Hello everyone,
Could anyone help on this. I have some of the pages which takes time to load and process the user's request. That is why our request performance is showing warning or critical status.
When i have checked JMX console for requestsStatus (HealthCheck), it shows This health check looks at the 75th Percentile (ms) in relation to warning and critical thresholds. The warning threshold is at 200 ms and the error threshold is at 500 ms.
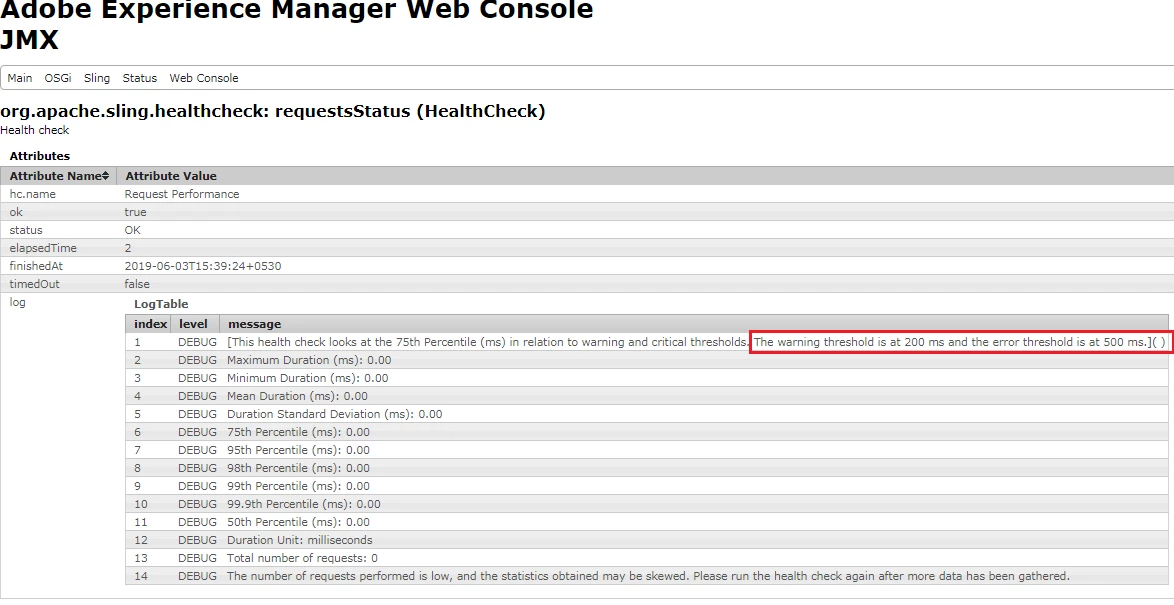
In our site few pages are takes more than 500ms and we have configured monitoring tool on it, Which is giving continuously alert for warning or critical for the same.
Can we increase the threshold value for request performance as we cannot reduce the load for these pages?
Solved! Go to Solution.
No, unfortunately it cannot be changed.
Can you please raise an Adobe Support ticket and raise an Enhancement Request so this can be configured?
thanks,
Jörg
Views
Replies
Total Likes
Uncertain if you can easily change the 200ms threshold but what you could do is disable the check altogether
1) /system/console/components
2) find : com.adobe.granite.requests.logging.impl.hc.RequestsStatusHealthCheckImpl
3) disable it.
No, unfortunately it cannot be changed.
Can you please raise an Adobe Support ticket and raise an Enhancement Request so this can be configured?
thanks,
Jörg
Views
Replies
Total Likes
Correct.
I have raised a adobe support ticket regarding the same and had a conversation with adobe person it is not possible to change the threshold value as it is hardcoded inside java code - RequestsStatusHealthCheckImpl.java and they don't have any future enhancement for the same.
They have suggested if require you can write a custom health check class to make it configurable accordingly.
https://helpx.adobe.com/in/experience-manager/6-3/sites/administering/using/operations-dashboard.htm... , Section : How to create Health Checks
Views
Replies
Total Likes