This conversation has been locked due to inactivity. Please create a new post.


This conversation has been locked due to inactivity. Please create a new post.
Does anyone know how to fix the issue depicted in the screenshots below? When attempting to view a delivery report, a Script Error pops up and the reports do not load - instead the "Loading data..." prompt continues to spin and never actually loads the reports.
This appears to be isolated to a single user, as I am able to access the reports using the same log-in credentials.
We've already attempted to clear the local cache and attempted to turn off script error notifications in Internet Explorer - but neither of those worked.
Any ideas?

Hi,
Compare the permissions of the broken operator against a functioning operator (Administration/Operators > Access rights, Audit/Folder Rights).
Also, redact client's name in your post.
Thanks,
-Jon
I don't see an edit button anymore - so not sure how to redact.
Also - it's not a permissions issue, as I am logging in using the same operator credentials as they are and I am able to see the reports, but they are not.
Views
Replies
Total Likes

/Hi Paciolan,
As you may know, Adobe Campaign Classic (ACC) uses internally Internet Explorer engine and its local settings on the PC user.
So, please compare the Internet Explorer version of this user PC with your own IE configuration. It must be IE11 because Adobe Campaign doesn't support older version.
Then have a look in IE extensions coming into conflicts.
But it is much easier for doing the same to see the report in standard IE page, because you can then activate IE debugger tool.
So use the report url from your Adobe Campaign client report and copy/paste in standalone IE browser.
If the report is not anynymous but needs authentication, you will need to authenticate with the operator id first.
So ease the debug by publishing an anynomous one.
For instance, in order to test your report, use:
http://yourdomain/report/nameofyourreport
orhttp://yourdomain/report/nameofyourreport
http://yourdomain/report/nameofyourreport?requiredparameter1=XXX etc (adapt it)
As for webApp, you can debug the context with &_debug&_uuid=youruuid (you can find it in the report preview mode url address).
Regards
J-Serge
Thanks J-Serge,
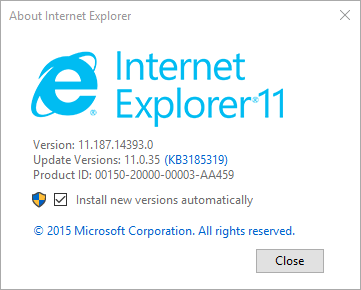
I can confirm that the user is on IE11 - see screenshot below.
What kinds of extensions would be conflicting?

Views
Replies
Total Likes

Hi Paciolan,
The Internet Explorer additional modules list (see IE burger menu) would help.
But you need some debug logs errors.
So please open the Internet Explorer developers tools (F12), and execute your report, it should show you in console or network or debugger tabs errors details. Sorry but it is technical, and could be so many reasons (conflict in Javascript, security blocks such as CORS, etc).
Moreover, execute the report in _debug mode in IE (or inside AC, in preview+debug mode) so you have a chance to understand what part is in conflict.
Regards
JS
Views
Likes
Replies
Views
Likes
Replies