Audience Metrics Side-by-Side via Data Distiller Query Pro Mode
Audience Metrics Side-by-Side via Data Distiller Query Pro Mode
Author: @annamalai (Senior Product Manager) & @pk83124183 (Architect)
Reviewers: @saurabhma2 (Group Product Manager) & @anilmalkani (Director Engineering)
Welcome to a guide on utilizing Data Distiller's Query Pro Mode to create an SQL-based analysis that compares metrics between two audiences.
First, consider why different personas would be interested in performing this analysis.
Use Cases by different personas
Marketer Manager
Evaluate audience growth and segmentation effectiveness: Analyze and compare trends of how specific audiences are evolving over time along with identity composition so it can help inform campaign planning and spending allocations.
Customer Insights Analyst
Use the trend and break down of identities in sync with the company specific audience name definition to derive business specific insights - ex: if segments are created for engagement of various products, then growth or shrink of those audiences point to a reflecting of broader marketing campaigns on those products
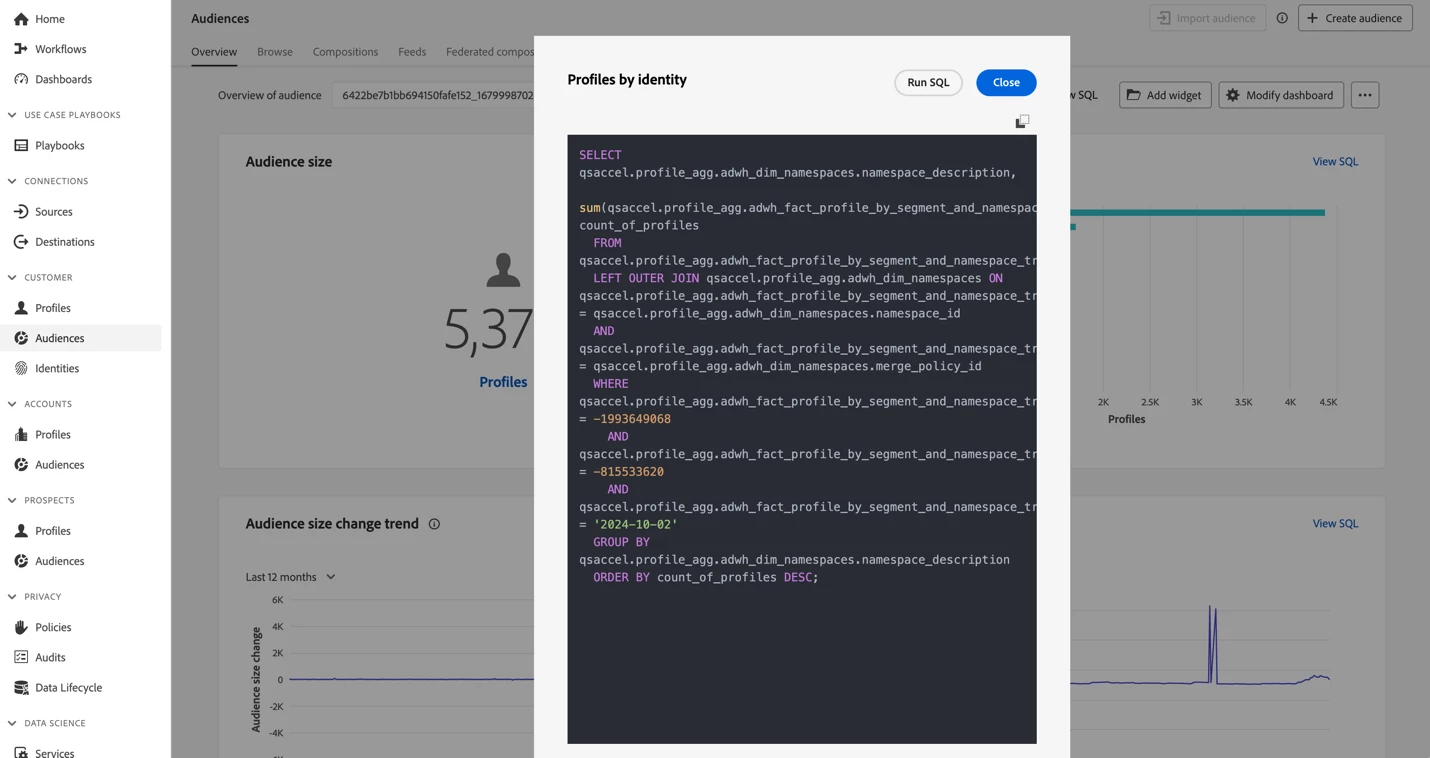
Step 1: Get SQL Inspiration from Standard Charts
The 4 KPIs I plan to use for my audience comparison dashboard are audience size, audience identity breakdown, audience size trend, and audience size change trend. While I am using these 4, you are welcome to take additional or different KPIs from the audience overview page. I select the toggle for ViewSQL to view the SQL for the desired charts and copy the SQL, which I can use in Data Distiller Query Pro Mode to author my comparison dashboard.
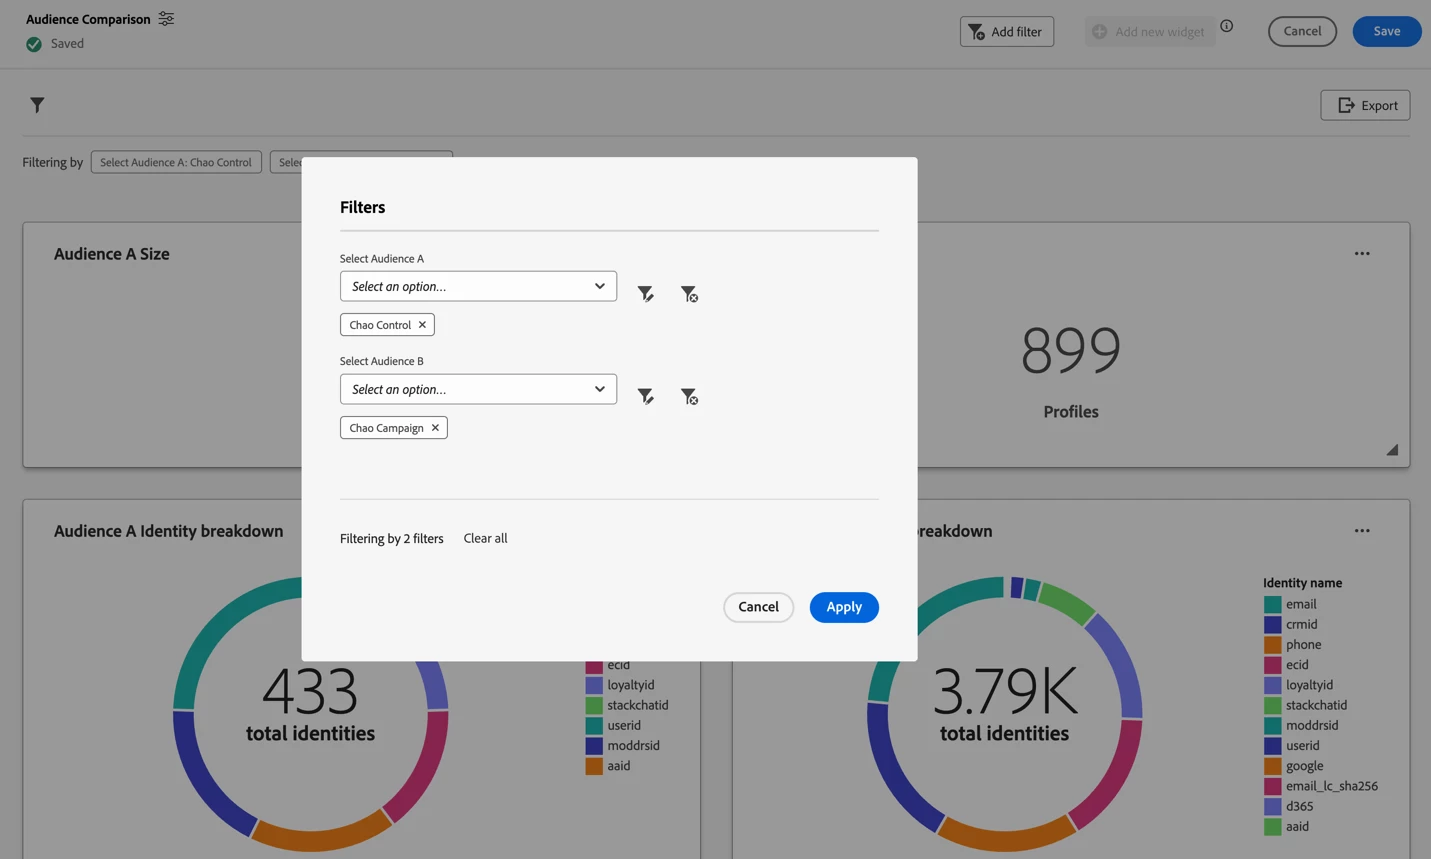
Step 2: Create Multi-Select Audience Filter
I can follow the filtering authoring tutorial to create my audience filter. The SQL I used is provided below. It brings in the audience name (segment name) to display for the user and the audience ID (segment ID) to pass to the chart SQL as a parameter. I have used two filters of the same type, one for Audience A and one for Audience B. The same four widgets will be used twice. One set will be linked to the filter for Audience A, and the second set will be linked to the filter for Audience B.
SELECT
  b.Segment_Name AS Value,
  b.segment_id AS ID
FROM
  qsaccel.profile_agg.adwh_fact_profile_by_segment_trendlines a
  JOIN qsaccel.profile_agg.adwh_dim_segments b ON a.segment_id = b.segment_ID
  JOIN qsaccel.profile_agg.adwh_dim_merge_policies c ON a.merge_policy_id = c.merge_policy_id
  JOIN (
    SELECT
      MAX(process_date) last_process_date,
      merge_policy_id
    FROM
      qsaccel.profile_agg.adwh_lkup_process_delta_log
    WHERE
      process_name = 'FACT_TABLES_PROCESSING'
      AND process_status = 'SUCCESSFUL'
    GROUP BY
      merge_policy_id
  ) d ON a.merge_policy_id = d.merge_policy_id
  AND a.date_key = d.last_process_date
GROUP BY
  b.Segment_Name,
  b.segment_id
ORDER BY
  b.Segment_Name limit 0;
Step 3: Build Advanced Audience Overlap Table
Finally, I can follow the Query pro mode documentation to author my table using the SQL I copied from the Step 1.
Each chart is created 2 times with the only different being that the first set is linked to Audience A filter and the second set to Audience B. Below are the SQL and chart authoring screen for reference.
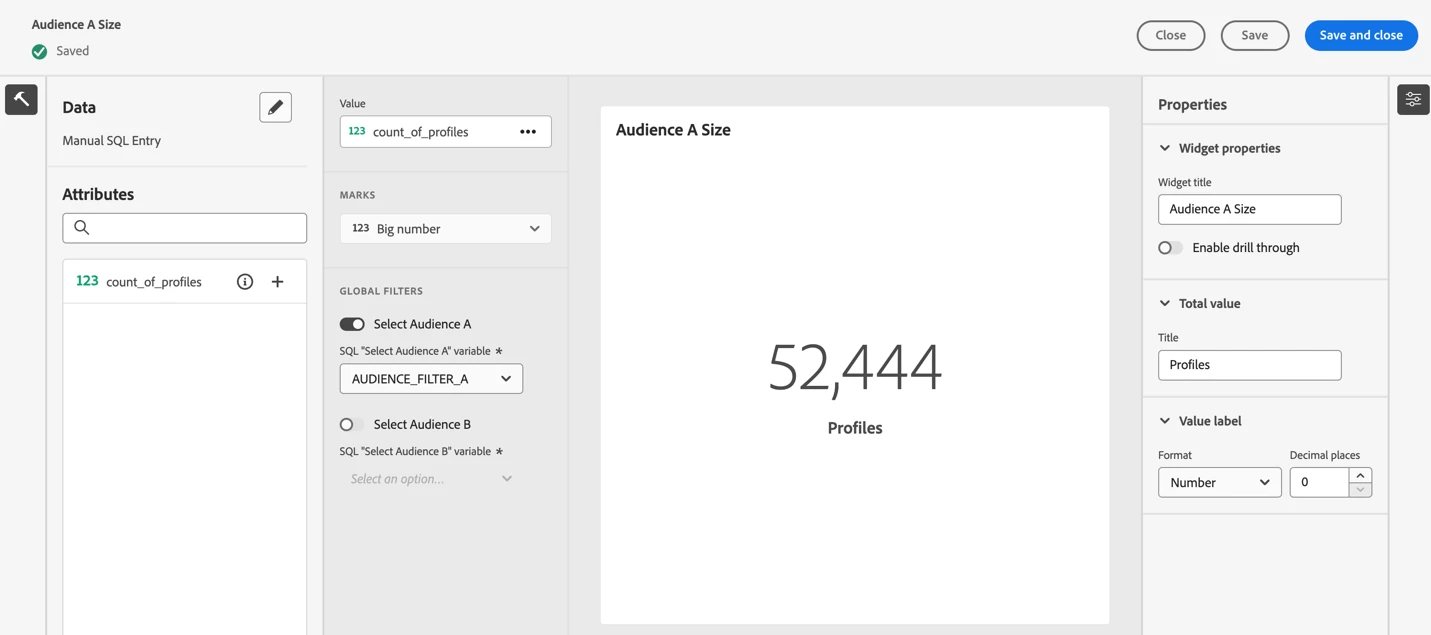
Audience Size SQL
SELECT
  SUM(a.count_of_profiles) as count_of_profiles
FROM
  qsaccel.profile_agg.adwh_fact_profile_by_segment_trendlines a
  LEFT JOIN qsaccel.profile_agg.adwh_dim_date b ON a.date_key = b.date_key
  LEFT JOIN qsaccel.profile_agg.adwh_dim_merge_policies c ON a.merge_policy_id = c.merge_policy_id
  LEFT JOIN qsaccel.profile_agg.adwh_dim_segments d ON a.segment_id = d.segment_id
WHERE
  (
    (
      UPPER(COALESCE($AUDIENCE_FILTER_A, '')) IN ('', 'NULL')
    )
    OR (d.segment_id IN ($AUDIENCE_FILTER_A))
  )
  AND b.date_key = (
    Select
      MAX(date_key)
    from
      qsaccel.profile_agg.adwh_fact_profile_by_segment_trendlines
    where
      (
        (
          UPPER(COALESCE($AUDIENCE_FILTER_A, '')) IN ('', 'NULL')
        )
        OR (segment_id IN ($AUDIENCE_FILTER_A))
      )
  )
Limit
  0;
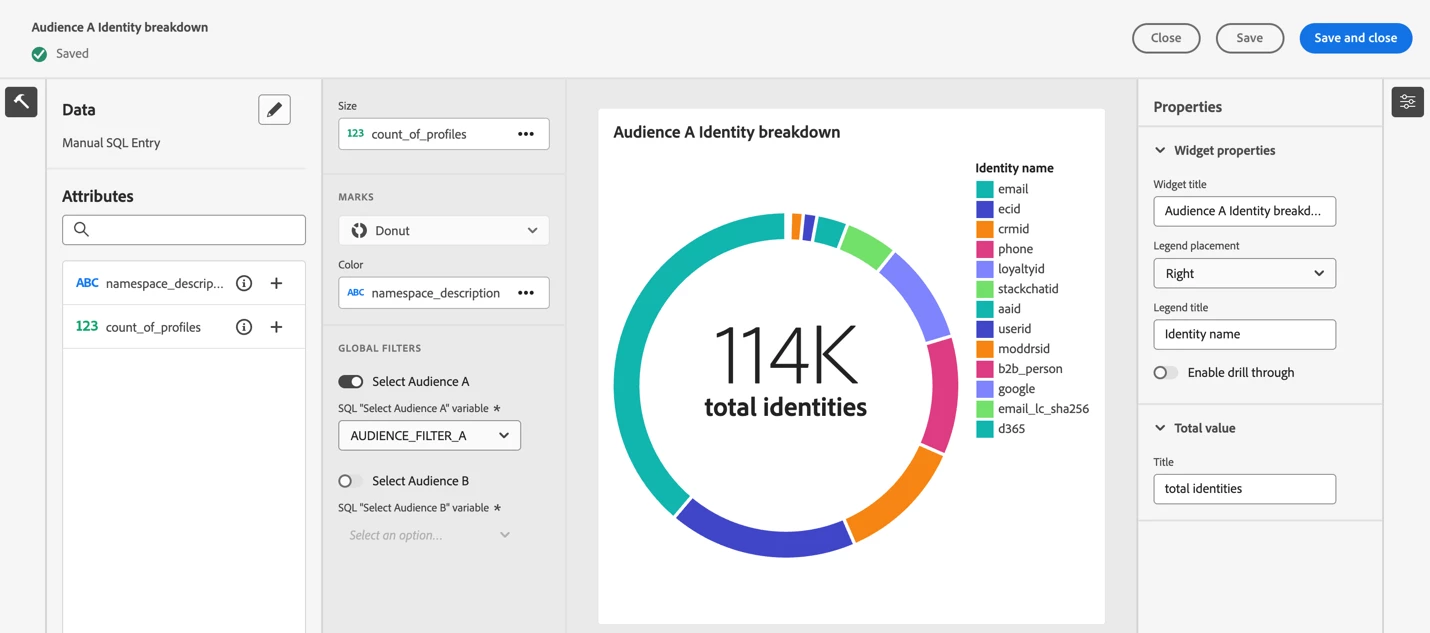
Audience Identity breakdown
SELECT
  qsaccel.profile_agg.adwh_dim_namespaces.namespace_description,
  sum(
   qsaccel.profile_agg.adwh_fact_profile_by_segment_and_namespace_trendlines.count_of_profiles
  ) count_of_profiles
FROM
  qsaccel.profile_agg.adwh_fact_profile_by_segment_and_namespace_trendlines
  LEFT OUTER JOIN qsaccel.profile_agg.adwh_dim_namespaces ON qsaccel.profile_agg.adwh_fact_profile_by_segment_and_namespace_trendlines.namespace_id = qsaccel.profile_agg.adwh_dim_namespaces.namespace_id
  AND qsaccel.profile_agg.adwh_fact_profile_by_segment_and_namespace_trendlines.merge_policy_id = qsaccel.profile_agg.adwh_dim_namespaces.merge_policy_id
WHERE
  (
    (
      UPPER(COALESCE($AUDIENCE_FILTER_A, '')) IN ('', 'NULL')
    )
    OR (
      qsaccel.profile_agg.adwh_fact_profile_by_segment_and_namespace_trendlines.segment_id IN ($AUDIENCE_FILTER_A)
    )
  )
  AND qsaccel.profile_agg.adwh_fact_profile_by_segment_and_namespace_trendlines.date_key = (
    Select
      MAX(date_key)
    from
      qsaccel.profile_agg.adwh_fact_profile_by_segment_and_namespace_trendlines
    where
      (
        (
          UPPER(COALESCE($AUDIENCE_FILTER_A, '')) IN ('', 'NULL')
        )
        OR (segment_id IN ($AUDIENCE_FILTER_A))
      )
  )
GROUP BY
  qsaccel.profile_agg.adwh_dim_namespaces.namespace_description
ORDER BY
  count_of_profiles DESC;
Audience Size trend
SELECT
  date_key,
  sum(count_of_profiles) AS audience_size
FROM
  qsaccel.profile_agg.adwh_fact_profile_by_segment_trendlines x
  INNER JOIN (
    SELECT
      MAX(process_date) last_process_date,
      merge_policy_id
    FROM
      qsaccel.profile_agg.adwh_lkup_process_delta_log
    WHERE
      process_name = 'FACT_TABLES_PROCESSING'
      AND process_status = 'SUCCESSFUL'
    GROUP BY
      merge_policy_id
  ) y ON x.merge_policy_id = y.merge_policy_id
WHERE
  date_key >= dateadd (DAY, -365, y.last_process_date)
  AND
  (
    (
      UPPER(COALESCE($AUDIENCE_FILTER_A, '')) IN ('', 'NULL')
    )
    OR (x.segment_id IN ($AUDIENCE_FILTER_A))
  )
GROUP BY
  date_key,
  segment_id limit 0;
Audience Size change trend
SELECT
  date_key,
  Profiles_added
FROM
  (
    SELECT
      rn_num,
      date_key,
      (
        count_of_profiles - lag(count_of_profiles, 1, 0) over (
          ORDER BY
            date_key
        )
      ) Profiles_added
    FROM
      (
        SELECT
          date_key,
          sum(x.count_of_profiles) count_of_profiles,
          row_number() OVER (
            ORDER BY
              date_key
          ) rn_num
        FROM
          qsaccel.profile_agg.adwh_fact_profile_by_segment_trendlines x
          INNER JOIN (
            SELECT
              MAX(process_date) last_process_date,
              merge_policy_id
            FROM
              qsaccel.profile_agg.adwh_lkup_process_delta_log
            WHERE
              process_name = 'FACT_TABLES_PROCESSING'
              AND process_status = 'SUCCESSFUL'
            GROUP BY
              merge_policy_id
          ) y ON x.merge_policy_id = y.merge_policy_id
        WHERE
          (
            (
              UPPER(COALESCE($AUDIENCE_FILTER_A, '')) IN ('', 'NULL')
            )
            OR (segment_id IN ($AUDIENCE_FILTER_A))
          )
          AND x.date_key >= dateadd (DAY, -365 -1, y.last_process_date)
        GROUP BY
          x.date_key
      ) a
  ) b
WHERE
  rn_num > 1 limit 0;
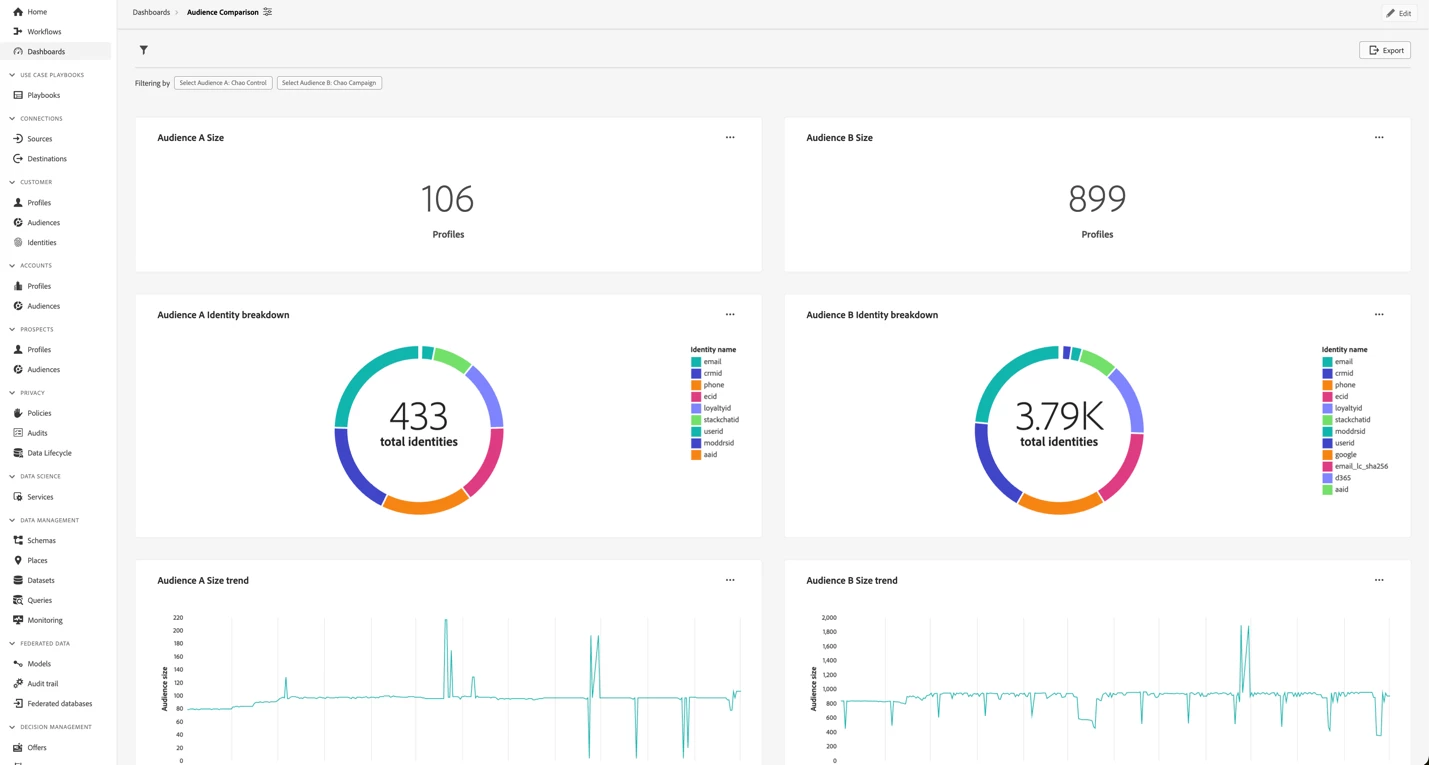
Final Outcome
And that's it. You set up this dashboard once, and every day, both business and technical personas can easily visit it, update the filters to select the desired audiences, and review the KPIs. What's more, you also automatically download it as PDF and CSV without any additional work. Below is the output of how it looks once completed.