Hi all - hoping you can help.
We want to understand how many unique visitors in a specific segment continue to be in the same segment over consecutive months.
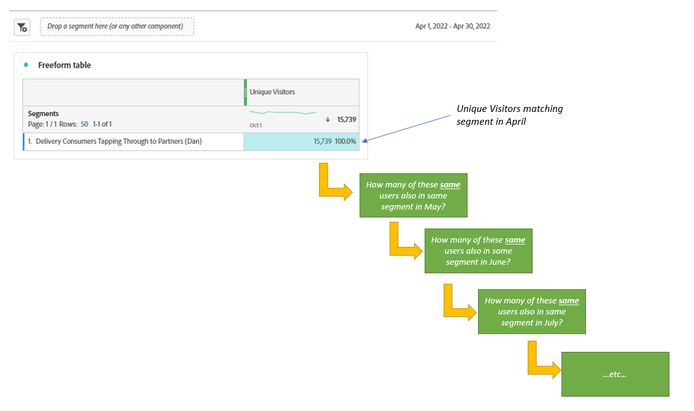
So, in the example below (excuse my poor Powerpoint skills), we know that there were 15,739 unique visitors are in a segment within April. We want to know how many of these same 15,739 visitors were also in the same segment in May, and then June, then July etc etc... So essentially creating a funnel of unique visitors by month.
We've thought of exporting all the raw data via DataWarehouse feature by month and using a series of 'VLOOKUPS' in Excel, but obviously would be far more efficient & usable if there was something within Analytics Workspace that could do the same in an automated way.
Any ideas / advice much appreciated! @Jennifer_Dungan ?
Example:
