Thanks, but this doesn't really show me the structure of your table.. I can see that you have segments as your breakdown.. I'm not sure if there are multiple.. do those segments have additional breakdowns, or just the segments... I am also going to assume you have some additional columns of metrics (which are also cut out of this screenshot).
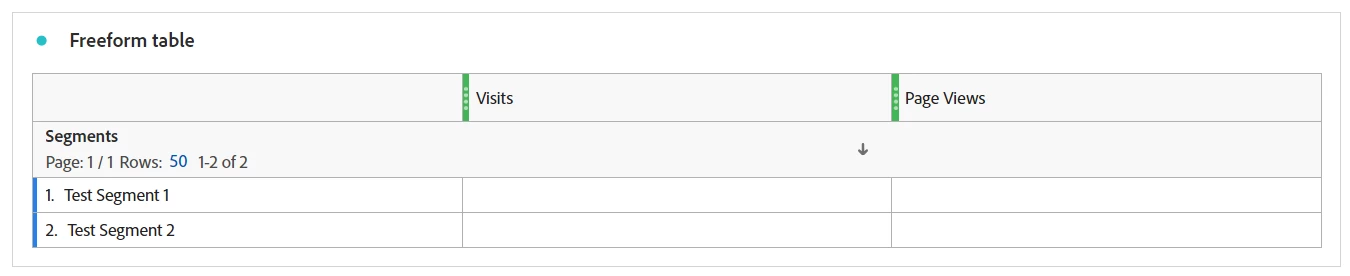
I am going to assume, something like this (multiple segments and multiple metrics):
My JSON (the last one that was run), looks like:
{
    "rsid": "xxxxxx",
    "globalFilters": [
        {
            "type": "dateRange",
            "dateRange": "2024-02-01T00:00:00.000/2024-03-01T00:00:00.000",
            "dateRangeId": "thisMonth"
        }
    ],
    "metricContainer": {
        "metrics": [
            {
                "columnId": "metrics/visits:::0",
                "id": "metrics/visits",
                "filters": [
                    "STATIC_ROW_COMPONENT_1"
                ]
            },
            {
                "columnId": "metrics/pageviews:::2",
                "id": "metrics/pageviews",
                "filters": [
                    "STATIC_ROW_COMPONENT_3"
                ]
            },
            {
                "columnId": "metrics/visits:::4",
                "id": "metrics/visits",
                "filters": [
                    "STATIC_ROW_COMPONENT_5"
                ]
            },
            {
                "columnId": "metrics/pageviews:::6",
                "id": "metrics/pageviews",
                "filters": [
                    "STATIC_ROW_COMPONENT_7"
                ]
            }
        ],
        "metricFilters": [
            {
                "id": "STATIC_ROW_COMPONENT_1",
                "type": "segment",
                "segmentId": "s000000000_000000000000000000000001"
            },
            {
                "id": "STATIC_ROW_COMPONENT_3",
                "type": "segment",
                "segmentId": "s000000000_000000000000000000000001"
            },
            {
                "id": "STATIC_ROW_COMPONENT_5",
                "type": "segment",
                "segmentId": "s000000000_000000000000000000000002"
            },
            {
                "id": "STATIC_ROW_COMPONENT_7",
                "type": "segment",
                "segmentId": "s000000000_000000000000000000000002"
            }
        ]
    },
    "settings": {
        "countRepeatInstances": true,
        "includeAnnotations": true
    },
    "statistics": {
        "functions": [
            "col-max",
            "col-min"
        ]
    },
    "capacityMetadata": {
        "associations": [
            {
                "name": "applicationName",
                "value": "Analysis Workspace UI"
            }
        ]
    }
}
I've obscured my segment ids, but you can that I have 2 segments (s000000000_000000000000000000000001 and s000000000_000000000000000000000002)
The JSON is mapping my 2 metrics against the "static rows" which are segments.
So I have 4 column ids, 2 for Visits (that map to the 2 segments) and 2 for Page Views (which also map to the 2 segments)
"columnId": "metrics/visits:::0",
"id": "metrics/visits",
"filters": [
    "STATIC_ROW_COMPONENT_1"
]
Maps my Visit Metric to "STATIC_ROW_COMPONENT_1", and "STATIC_ROW_COMPONENT_1" is defined below with the segment id:
"id": "STATIC_ROW_COMPONENT_1",
"type": "segment",
"segmentId": "s300007135_65c86f2e0e503637bad71f6b"
Each of the 4 cells of data is defined this way.
This is the data as returned by the debugger.