Plotting Cumulative Graph In Adobe Analytics | Community
Skip to main content
Level 2
August 8, 2022
Solved

Plotting Cumulative Graph In Adobe Analytics

  • August 8, 2022
  • 1 reply
  • 2620 views

Hi,

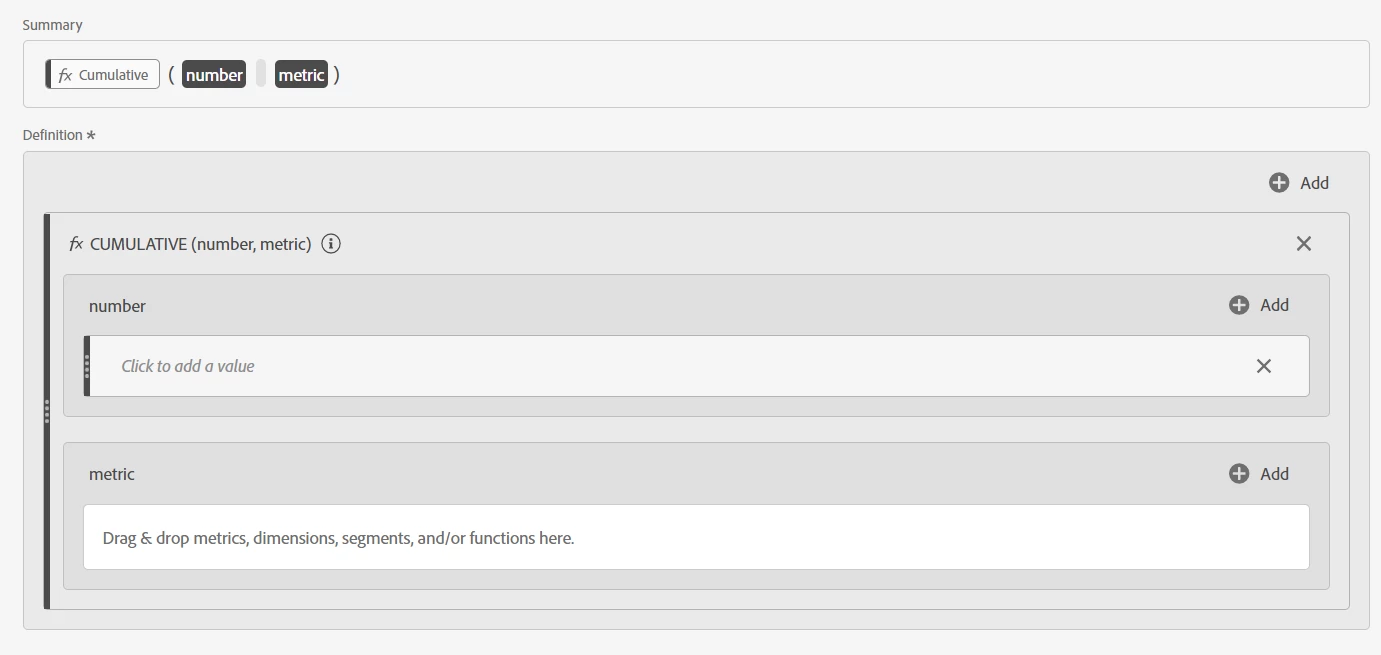
  I want to plot cumulative graphs in AA. Currently it supports daily graph. Is there a way we can get it easily?

For now I am using custom date ranges to achieve it. But this is resulting in too much of manual effort.


Eg. of Custom Date Ranges Segments below

Use Case : AB Analysis

Best answer by Jennifer_Dungan

You can create a custom calculation metric for "Cumulative"


In Calculated Metrics do the following:


  • Add: Function
  • In the Select area, start searching for "Cumulative" (there is both "Cumulative" and "Cumulative Average"
  • Then as the screenshot above, you can specify either the number of rows you want to include (or use "0" to make the cumulative average use all rows in your report date range)
  • Then pull in the metric you want to use


Hopefully you have the rights to create custom metrics, or you may have to get your admin person to create a "Cumulative Average Metric X" that you can use in your reports.


Good luck.

1 reply

Jennifer_Dungan
Community Advisor and Adobe Champion
Jennifer_DunganCommunity Advisor and Adobe ChampionAccepted solution
Community Advisor and Adobe Champion
August 8, 2022

You can create a custom calculation metric for "Cumulative"


In Calculated Metrics do the following:


  • Add: Function
  • In the Select area, start searching for "Cumulative" (there is both "Cumulative" and "Cumulative Average"
  • Then as the screenshot above, you can specify either the number of rows you want to include (or use "0" to make the cumulative average use all rows in your report date range)
  • Then pull in the metric you want to use


Hopefully you have the rights to create custom metrics, or you may have to get your admin person to create a "Cumulative Average Metric X" that you can use in your reports.


Good luck.

Level 2
August 8, 2022

This works!


This method works like a charm for metrics which are additive in nature eg. Orders, no. of page views.

Although for Unique Visitors(UV) it gives different values than what I wanted.


Eg. Data at a Daily Level

Aug 1 has 10 UVs

Aug 2 has 10 UVs


Now for Aug 1 to Aug 2 :
UV count will be less than 20 as some visitors are getting repeated and not 10+10 = 20.


Currently the above method gives 20, Is there any work around for metrics which are not additive?


Jennifer_Dungan
Community Advisor and Adobe Champion
August 8, 2022

Ah... interesting that it's double counting your UVs... likely cause it's looking at them as individual daily granularity....


But you're right... that's not what you need.... hmm I was trying to play around with this and so far have not found a solution... but I am not going to give up.... let me try playing with this and I will get back to you....