Expand my Community achievements bar.

Applications for the 2024-2025 Adobe Analytics Champion Program are open!
SOLVED

Marketing channel showing higher visits in visualization

Avatar

Level 3

Hi AA Team

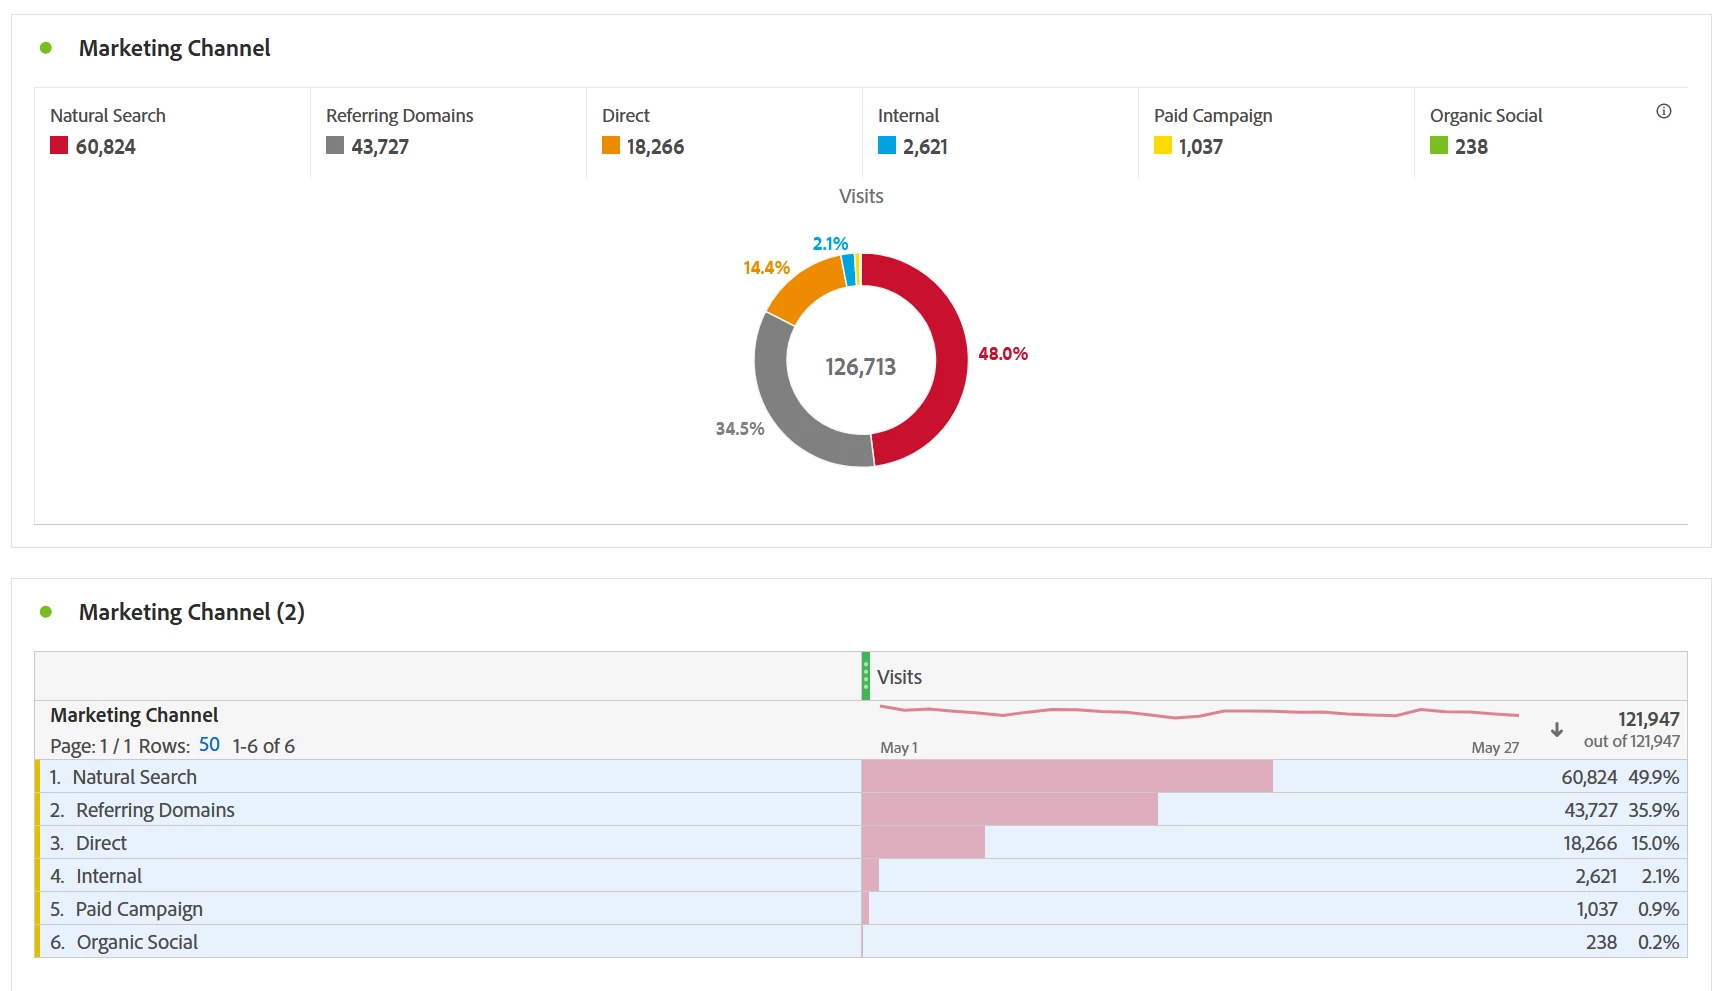
We have an issue were when visualizing the data its showing a higher number in the doughnut chart.

The variance between the freeform table and the doughnut chart is creating confusion

Kindly advise the best way to visualize the data.

Thanks


cparthasarathy_0-1695516436953.png


Topics

Topics help categorize Community content and increase your ability to discover relevant content.

1 Accepted Solution

Avatar

Correct answer by
Community Advisor

I should add.. part of why selecting the individual rows shows the "summed" total, is because if you were to select only 3 of your 6 Marketing Channels (or really any dimension), the donut chart needs to display against the "100 % total" so it will sum the values from the selected rows.


It's just that when you have your metric (such as visit) apply to multiple rows it can result in discrepancies.

View solution in original post

4 Replies

Avatar

Community Advisor

In your freeform table, the Visits total has been de-duplicated for visits with multiple channels; if you add the actual numbers up, you will see that they add to a higher number (126,713) than to the de-dpuplicated total of 121,947. (if you add up the percentages, you will see that those add up to 104%)


Donut charts, by their nature, cannot show more than 100%, so when visualized in this way, it cannot show the de-duplicated total; it takes the "added" total and shows the percentages from it (hence why the percentages also don't match, Natural Search in the freeform is 60,824/121,947 making it 49.9%; but Natural Search in the donut is 60,824/126,713 making it 48.0%)


Now, you may be wondering how you have multiple Marketing Channels in a Visit... (If you are coming from a GA background, you should understand that Adobe does not create a new session/visit when a user comes back with an attached campaign, Visits are based on time alone... so as long as the user has been inactive less than 30 minutes, the session will extend)


Let's look at a simple scenario:


  • User on Google, clicks through to your site
  • Page 1
    • Start of Visit
    • Marketing Channel is set to "Natural Search"
  • Page 2
    • Last Touch Marketing Channel is still "Natural Search"
  • User exits back out, but still within the 30 min session, clicks on a Paid Campaign link back to your site
  • Page 3
    • This is still part of the same visit
    • Marketing Channel is set to "Paid Campaign"
  • Page 4
    • Last Touch Marketing Channel is still "Paid Campaign"


This single visit has two different Marketing Channels... the first part of the visit (pages 1 and 2) are "Natural Search" and the last part of the visit (pages 3 and 4) are "Paid Campaign".


Marketing Channels are "Last Touch" but this doesn't mean that the earlier data is overwritten.. lets assume that the above scenario also had 2 conversions... one in the first half of the visit, and one in the second half of the visit... it would be fundamentally wrong to attribute the first conversion to "Paid Campaign" since the user hasn't even seen the campaign at this time.... you would want it to be properly attribute to the Channel that brought them to the site (Natural Search), and then the second campaign after encountering and interacting with a paid channel would be associated to the proper channel.


The "Last Touch" designation, is more about stitching Channels to Conversions... but when looking at something like Visits, you will see some oddities like this, where there is Visit duplication across rows.


Now, here is an interesting behaviour quirk that you may not be aware of.... if you select the "Visits" metric when rendering your Donut Chart, you will get a matched (de-duplicated) total:


Jennifer_Dungan_0-1695570451984.png


If you choose the individual rows, you will get the "summed" total:

Jennifer_Dungan_1-1695570529891.png


You will also notice that even though I have 9 Marketing Channels, I limited my max items to simplify the visualization:

Jennifer_Dungan_2-1695570609227.png


So to fix your issue, make sure you are selecting the metric header.. unfortunately, for some reason you cannot lock the visualization to that selection (so if people are clicking around they could change what the donut is showing....)


Basically, what you are seeing isn't an error, its really just a result of some visits having multiple channels and how that data is visualized and calculated differently based on the display type and what scope is selected for the visualization....

Avatar

Correct answer by
Community Advisor

I should add.. part of why selecting the individual rows shows the "summed" total, is because if you were to select only 3 of your 6 Marketing Channels (or really any dimension), the donut chart needs to display against the "100 % total" so it will sum the values from the selected rows.


It's just that when you have your metric (such as visit) apply to multiple rows it can result in discrepancies.

Avatar

Community Advisor

You're welcome


Sometimes scope can be "interesting" to deal with...