Is it possible to get metrics and flows based on a specified journey?
- Mark as New
- Follow
- Mute
- Subscribe to RSS Feed
- Permalink
- Report
I am running an experiment and would like to understand how the beginning user journey may impact choices and time spent at the final point in the user journey.
Specifically, I would like to understand exit rates on the final page of the user journey, the average time spent on the final page, and also a fall-out view showing where my users go to after the final page.
In my scenario, I have 2 different starting pages, but they all lead to the same final page as the user goes through the flow.
I was wondering if the following logic would get me what I am after.
First, I create a fall-out with the specified journey I am interested in:
Journey 1:
custom_link = Experience_A --> custom_link = CTA_1 --> page_url = www.finalpage.com
Journey 2:
custom_link = Experience_B --> custom_link = CTA_1 --> page_url = www.finalpage.com
If I create two segments for these two journeys, and apply the metrics: Exit rate and Time Spent per Visit, will that give me the exit rate and time spent per visit for the final step of this flow? Or would the time spent per visit give me a cumulative time based on the entire flow?
Similarly, how would I get a flow view for the post-final page journey that each user makes? I am unable to drag my segment into any of the following fields:
Thanks!
Solved! Go to Solution.
Views
Replies
Total Likes

- Mark as New
- Follow
- Mute
- Subscribe to RSS Feed
- Permalink
- Report
Hi @asdf12341z --
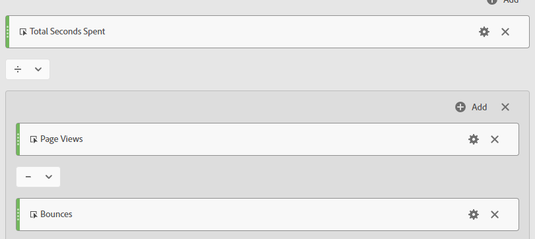
You would have to apply URLs and filter for www.finalpage.com as your data row and then apply the segments separately (either as a dropdown for the panel or as a column subset for the metrics. You can use Exit Rate, but I would create a calculated metric for Average Time on Page instead of Time Spent Per Visit. As you noted, Time Spent Per Visit will cover the entire session, while the calculated metric covers only that specific page. Here's how I have created the Average Time on Page metric for my org:
Hope that helps!

- Mark as New
- Follow
- Mute
- Subscribe to RSS Feed
- Permalink
- Report
Hi @asdf12341z, I'm not exactly sure this will get you what you want, but if you use your filter on top of the desired metrics, and break out by exit page. This should show you the top exit pages, exit rate, and time spent on page.
Also, for the flows you're having trouble making, try using your segment at the panel level. Once you add the flow visualization, drop in your desired page as the end of the flow.
- Mark as New
- Follow
- Mute
- Subscribe to RSS Feed
- Permalink
- Report
Thank you both for the suggestions!
Views
Replies
Total Likes


