Expand my Community achievements bar.

Error with Avg. Time On Site's Percentage Change calculation?

Avatar

Level 2

I used the "Compare time periods" option to generate a % change in Avg. Time On Site. However, when I calculated it online, the % change was different. 


For example, 

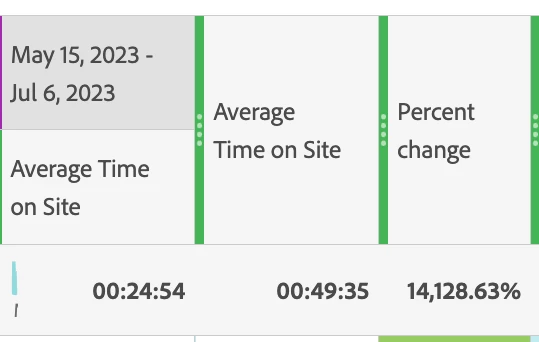
In the screenshot from the "External Campaigns Traffic" section, the % change for 00:24:54 and 00:49:35 Avg. time on site is showing as "+14,128.63%" which was a strange percentage to me. 

When I ran a calculation online it showed a % change of +90.13%.

Screenshot 2023-09-29 at 1.04.24 AM.png


I had removed a few rows at the very bottom of that chart that were displaying "0"s for visits. Could this have affected the calculation? I ended up checking the % change for ever section and for every section my calculation was different than what was calculated in Adobe Analytics. 


Is there a better metric I could be using?

1 Reply

Avatar

Community Advisor

I don't use Adobe's time metrics much, nor have I created a compare time periods like this, but I just tried it myself, and the values look correct to me in my data..


But that is very clearly wrong....


I would suggest trying that again from scratch.. but if you get the same result, I know that some of the time metrics get a little weird when Segments are applied... so it could be something like that affecting this.


You could try to use the "Time Spent per Visit (seconds)" metric (you can create a calculated metric with this to have it displayed as time, just like the Average Time on Site)

Jennifer_Dungan_0-1696041263213.png


And try to use that in your Compare Time Periods....


Good Luck