Expand my Community achievements bar.

Join us for the next Community Q&A Coffee Break on Tuesday April 23, 2024 with Eric Matisoff, Principal Evangelist, Analytics & Data Science, who will join us to discuss all the big news and announcements from Summit 2024!
SOLVED

Calculated metric and breakdown : a story of table filtering

Avatar

Level 1

Hi there,

i created a metric that, by design, seems not able to be displayed in line chart (for example) :

tgd77_0-1672394140785.png

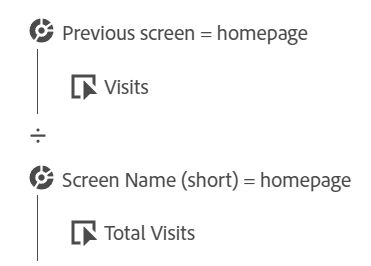
The idea is to calculate some pages visits with homepage as previous screen, and divide this by the total visits of the homepage.

The thing is, it works fine when you put it in a table with all the pages as dimension, because the homepage visits are already calculated in this table. BUT, if you create a line chart for one of these pages or try a breakdown by day (for example) it gives "infinity". The explanation is these two options are, in terms of data manipulation, the same : a new filtered table is created on a specific page for the breakdown, and there's not "homepage" in this new table. So homepage total visits is 0 in this table. Divide something by zero doesn't generally work


I wonder if there was some solution for this. Like an "Except" in PowerBI or something in the calculation, to prevent filtering in the second part of the calculation. Or a method to organize my board to obtain the result.


I think it's limited by design, but i don't know Adobe Analytics as much as other solutions.


Thanks for the help

1 Accepted Solution

Avatar

Correct answer by
Community Advisor

Given that choosing a specific page acts like an over-arching segment, I am not sure if you can do this in Workspace...


You might be better off exporting the data using Data Warehouse (or pulling into Excel directly using Report Builder), then doing the calculations and graphing there?

View solution in original post

2 Replies

Avatar

Correct answer by
Community Advisor

Given that choosing a specific page acts like an over-arching segment, I am not sure if you can do this in Workspace...


You might be better off exporting the data using Data Warehouse (or pulling into Excel directly using Report Builder), then doing the calculations and graphing there?

why need to go into excel to do all the things manually and takes too much time. instead of better we can use some fine version of data forming sheets.