Here is what I would do to create a calculated metrics for Visit % Month Over Month Delta :
Calculated Metrics Summary:
(Visit - ((function Cumulative (number 2 metric Visit sort_by ascending_sort true) - function Cumulative (number 1 metric Visit sort_by ascending_sort true)))) / ((function Cumulative (number 2 metric Visit sort_by ascending_sort true) - function Cumulative (number 1 metric Visit sort_by ascending_sort true)))
Note: Replace "visit" with any desired metrics above to visualize % Month Over Month Delta for the chosen metric.
Snapshot:


WorkSpace Table:
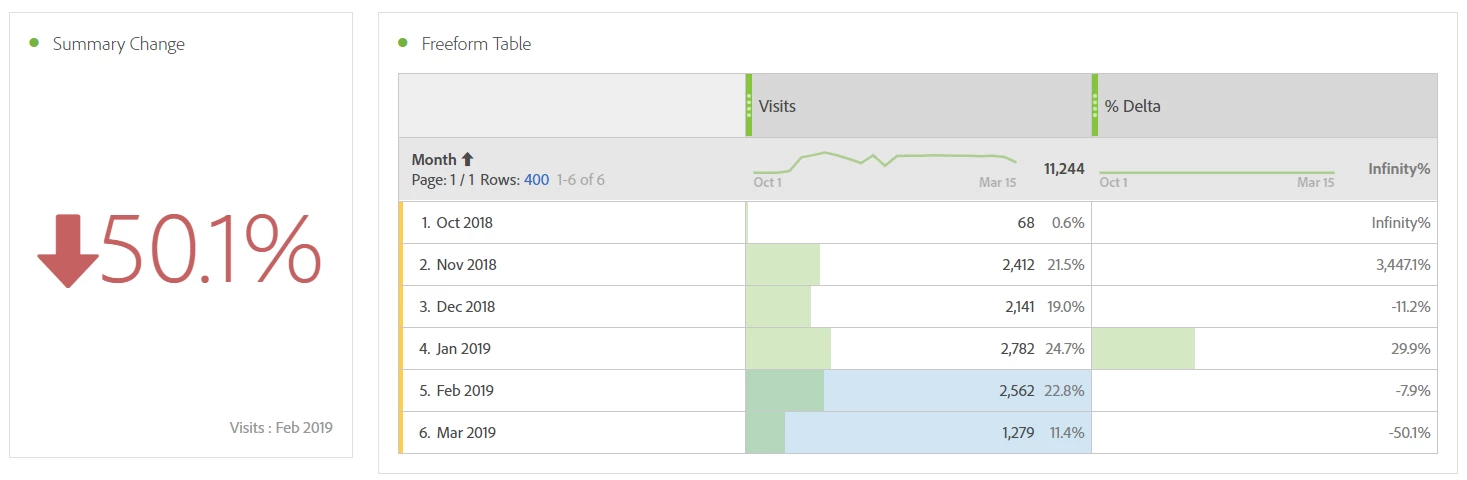
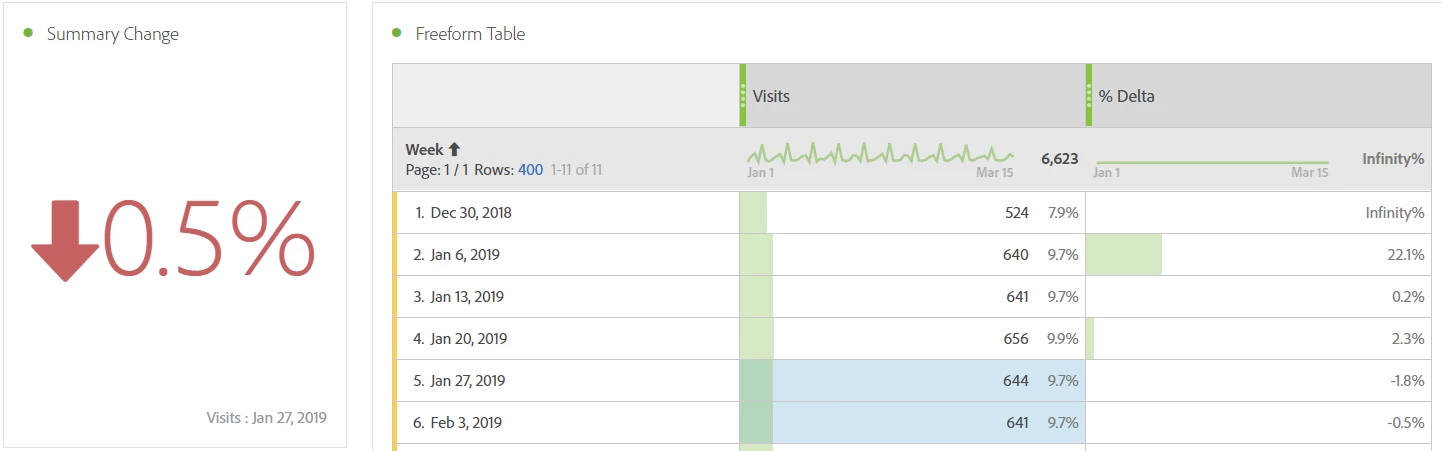
You can use any time dimension to calculate % delta in place of the month (weeks, days etc.). The metric will auto adjusts the calculation for the applied time dimension.
Month over Month
Week over Week
QA:
See summary change for highlighted week/month with the corresponding week/month row value. % delta value should match with it. See snapshot above.
Thanks,
Asheesh