활동이 없어 이 대화는 잠겼습니다. 새 게시물을 작성해 주세요.
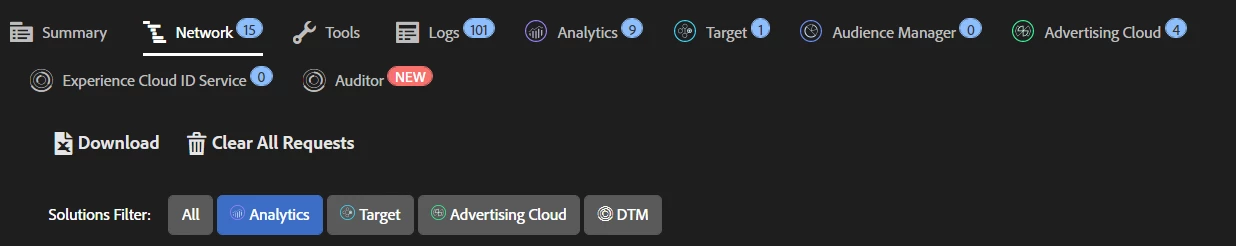
What do you find is the easiest debugger to use? I used to use HttpFox and thought that was great - showed a page firing and e.g., if multiple page views firing on a page - this would show up. The new Adobe Analytics debugger I feel is too large and a bit cumbersome. Not sure what the numerous number of columns mean - does that mean there are that many, e.g., page views firing?
해결되었습니다! 솔루션으로 이동.
Adobe Experience Debugger plugin provide all the server call triggered for the Experience cloud solution. To narrow down to a specific solution, you can do the filter by Solution and see the specific solution which are given color legends to represent. Columns of server represent all pageview and link click calls.
조회 수
답글
좋아요 수
Use the network tab of your browser.
Filter by b/ss and you should see all Adobe Analytics server calls. (should be under Params)
See this :
You can find the list of the query params and what they mean here Data collection query parameters
I narrowed down to "Analytics" and saw the home page and all the variables (guessing these are the variables that fired?). Clicked and went to another page and 3 more columns opened. Two of the columns came from the home page and the 3rd is the page I went to. Looks like the 1st two columns are both actions on the home page (both had Page Name as homepage). 1st of the two columns had the "Link URL" that was the next page I went to; and the 2nd had the link clicks. Does it always show different columns for each item that fired? This does NOT mean, e.g., 2 page views fired - correct? We've seen that before where multiple page views were fired for the same page (via HTTPFox). The 3rd column had the variables for the page I went to.
Going to another page from there popped up 4 more columns. Each had slightly different variables for the page I left, with the 4th page being the page I went to.
Am I interpreting correctly?
조회 수
답글
좋아요 수
You can also take a look at the "Analytics" Tab. It is geared more toward just debugging for Analytics. That will give you an idea of what hits are being fired. From left to right is the order in which the hits are being sent. On the Analytics Tab it will also show you whether the hit is a Custom Link hit or a Page load hit by looking at the "Link Name" column.
조회 수
답글
좋아요 수
I personally use ObservePoint Debugger but you can always use the network tab or Charles or Adobe Debugger.
Thanks!
조회 수
답글
좋아요 수
Hi sharon19403573 , You need to understand the differentiation between page view and custom link request. Only then you can interpret any debugger properly.
조회 수
답글
좋아요 수
The chrome extension "Launch and DTM Switch Offered by: Search Discovery" has been a lifesaver for me, used in conjunction with "Debugger for Adobe Analytics Offered by: Tomas Balciunas"
조회 수
답글
좋아요 수
I like the "oid" "classic" Digital Pulse bookmarklet debugger myself because the new debugger injects a lot of extra nonsense into the page and sometimes this causes conflicts. I'm becoming more of a purist of late, and I also like using the browser inspector Network tab.
조회 수
답글
좋아요 수
Yes! And simpler and easier to understand pretty quickly without having to scroll through through columns and columns. How did you get the "classic" debugger?
조회 수
답글
좋아요 수
The classic debugger will only display GET requests. Any requests sent using POST will not be displayed.
If you are using AppMeasurement.js and VisitorId services, if the server call go over a specific length it will automatically be send using POST.
I still think using the network tab of the developer tools of your browser is the best way.
You can also do the following to see the Adobe server calls in your console.
Add the following:
s.debugTracking=true;
조회 수
답글
좋아요 수