Expand my Community achievements bar.

Join us for the next Community Q&A Coffee Break on Tuesday April 23, 2024 with Eric Matisoff, Principal Evangelist, Analytics & Data Science, who will join us to discuss all the big news and announcements from Summit 2024!
SOLVED

Adobe analytics 문의 드립니다.

Avatar

Level 2

ask.png

안녕하세요.

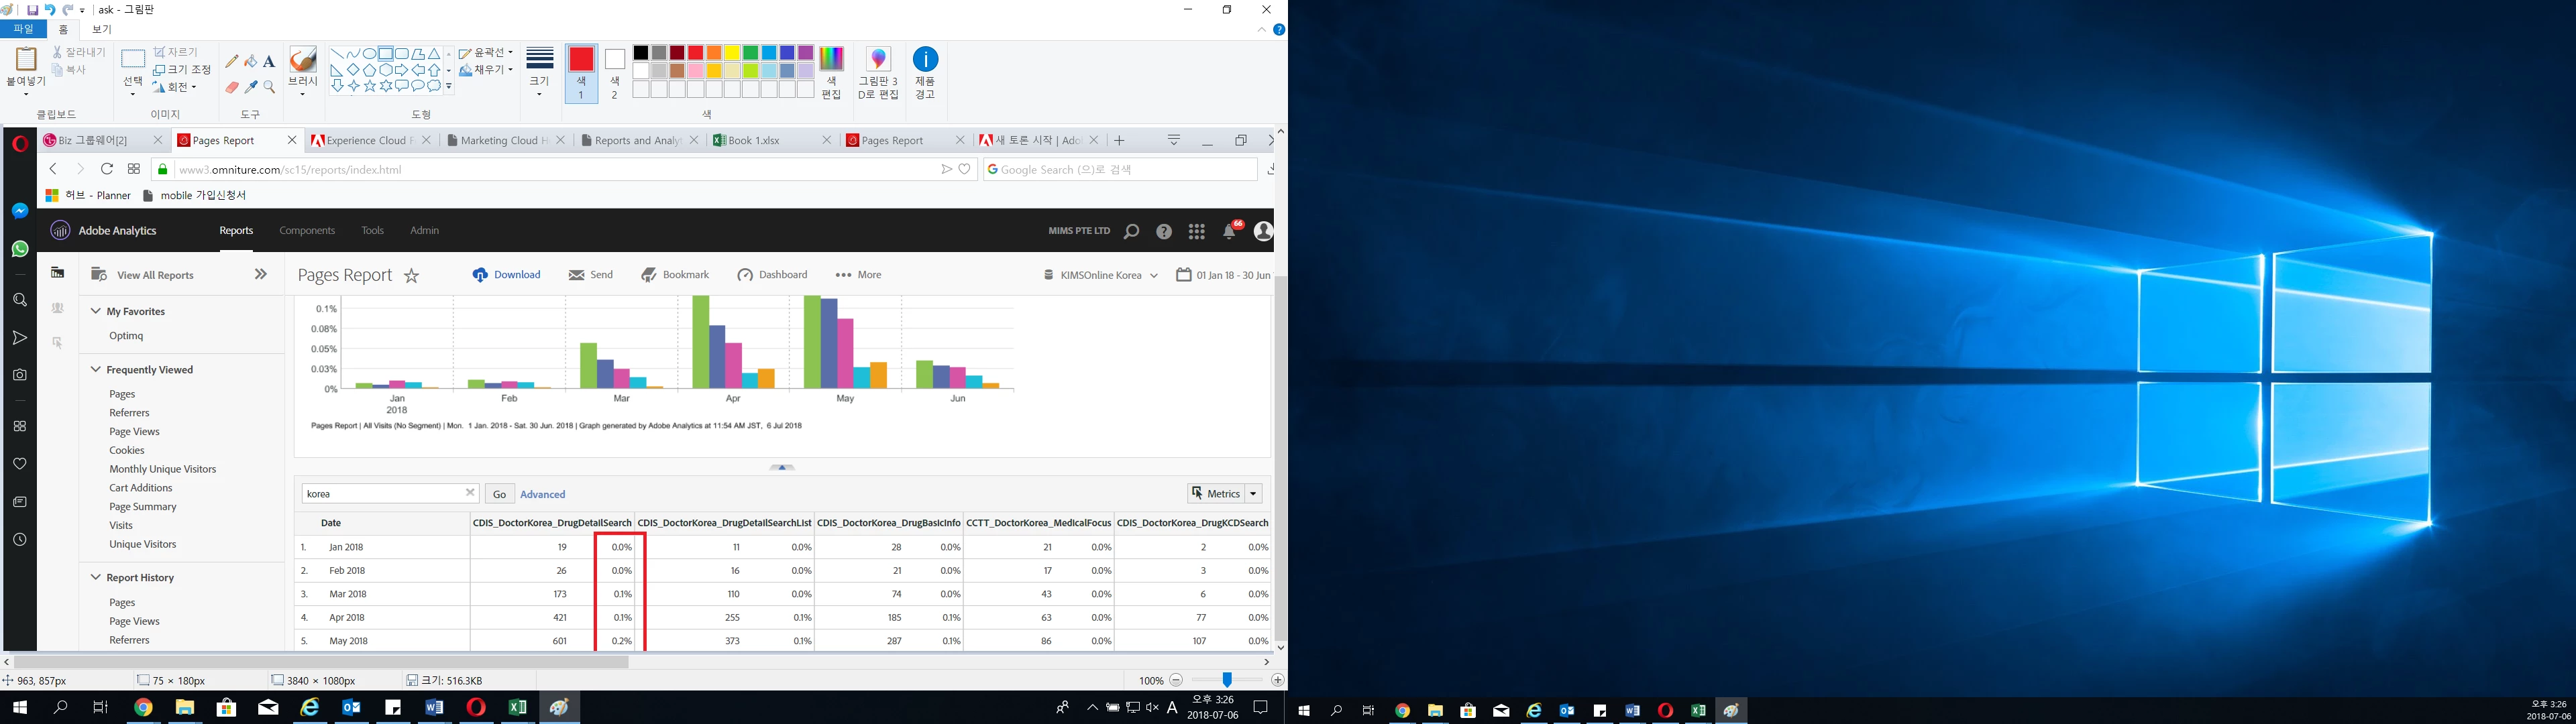
왼쪽 캡쳐 화면의 빨간색 선 안에 있는 %가 뭘 나타내는지를 모르겠습니다.

위 화면은 UV를 월별 기준으로 조회한 후 나타나는 화면이며 UV 숫자 옆에 %가 있는데 그 의미를 알려주시면 감사하겠습니다.

부탁드립니다.

1 Accepted Solution

Avatar

Correct answer by
Employee Advisor

It looks like this is a legacy trended report.

The percentage means how much that specific line item contributed to the entire pages report in that month. If there was a column for every page on your site, each row would equal 100%. However, that report only supports 5 columns.

You could try using Analysis Workspace, which is much more flexible in getting data out of Analytics.

Also PratheepArunRaj, there's a translate button available in the bottom right of each post so we can accommodate international communities

View solution in original post

2 Replies

Avatar

Community Advisor

Hello Deo,

If you can raise the question in English Language, it will be helpful for everyone to answer you. Kindly do.

Translator is not exact.

Thank You

Arun

Avatar

Correct answer by
Employee Advisor

It looks like this is a legacy trended report.

The percentage means how much that specific line item contributed to the entire pages report in that month. If there was a column for every page on your site, each row would equal 100%. However, that report only supports 5 columns.

You could try using Analysis Workspace, which is much more flexible in getting data out of Analytics.

Also PratheepArunRaj, there's a translate button available in the bottom right of each post so we can accommodate international communities