Context is necessary for understanding. Understanding is a process that encompasses three fundamental elements: content, context, and the vehicle. The content represents the information, ideas, or messages being conveyed—the core substance of the communication. However, the interpretation of this content is profoundly influenced by the context in which it is presented. Context involves the broader setting, encompassing social, cultural, and situational factors that contribute to the meaning of the message. A third element is the vehicle, which serves as the means through which the content is transmitted—whether it be spoken words, written text, Excel grids, visualizations, power points, or other forms. These elements significantly impact how your message is received and understood. In this discussion, we will look at one aspect of context that is specific to metrics.
If you have been in marketing for any length of time, you know a number presented in isolation lacks meaning. For example, the answer could be “42”. What does that mean? Is it a positive or negative outcome? Without context, it is impossible to say. Often, you provide context when you compare the metric to something.
An "internal" comparison looks at the performance of an element on your site and compares it to something on your site. That something becomes your baseline. These are “relative” comparisons used to identify an increase or decrease and by how much. It answers the question “Is it better now?” This is distinct from an “external” comparison which involves evaluating your site against competitors or general industry benchmarks. Three basic ways to compare metrics in an internal comparison are trended, segmented, and contribution.
Trending
A trended metric is a time based measure tracking how a specific numerical value changes over time. In January it was 42, in February it is 43. It shows you performance over a meaningful duration. In effect, the history of the measure becomes the relative benchmark for the current value. Some forms of testing are also an example of simple trend tracking. In this case one compares the value before and after the change is made. It is a comparison using specific points in time around which to create a comparison.
Trending is one of the most useful methods you have to provide context. It is often used in the context of segmented and contribution comparisons (described below).
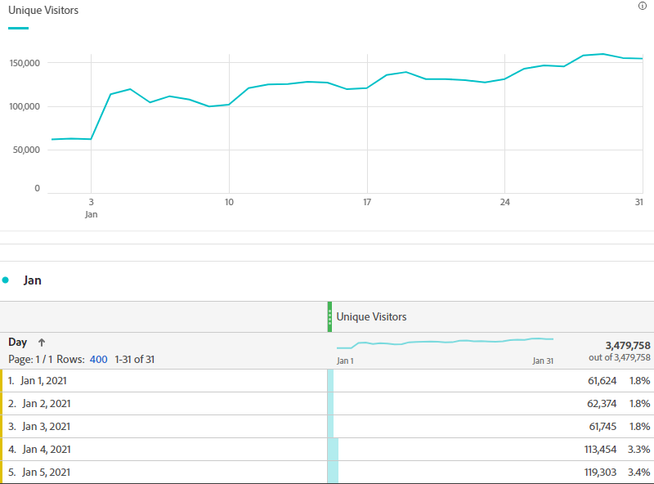
Below an example of a trended report showing Unique Visitors for a site section. Looking at the trend, you can easily see the Visitors increased starting Jan 3 and progressively thereafter.

Segmentation
Another way to provide context is by segmentation. Changes in higher level tracking are investigated by segmenting the contributing pages or metrics at a more granular level to see what changed. For pages or site sections, it is a “vertical” segmentation. Typically, if a trend changes, you investigate the reasons for the change by drilling down to find the “contributors”. The segmentation provides context for the overall number. Some basic page segmentation levels are:
- Site
- Page Group
- Page
- Link Group (module)
- Link
For example, if you are looking at PV/Visit for the site overall you might investigate any changes by looking at the same metric for various page groups. These are sub-sets (segmentations) of the site. Examples of page groups are subject, page type (form, article, news, etc.), site area (pillar), tool type, and application. You can then go further and look at the PV/Visit of individual pages within the page group and then the links on any given page of interest.
Note that these are page segmentations rather than audience segmentations. In addition to tracking what pages changed, you can also segment by audience to determine if the audience has changed.
There is another type of segmentation that applies to compound metrics. These are rates and percentages etc. such as Page Consumption (PV/Visit), Repeat Use (Visits/User) or Visit Duration (Time Spent / Visit). In this case, when the metric changes, look at the component of the metric itself to see what changed. For example, for PV/Visit did the Page Views or the Visits change, or both? Again, this can be looked at for various levels of the site to understand what is driving the change.
These types of segmentation will tell you what components are driving changes on your site. In general, the more granular the level of tracking, the more the information tends to be tactical and actionable. Looking at the trends of your segments can provide insight into the near future of your asset.
Contribution
Contribution can show part to whole relationships. It can compare a part of your site the total of similar parts, where the total becomes your benchmark.
Contribution can aso compares a part of your site to another similar part of your site. A “horizontal” comparison allows you to compare pages, page sets, and applications at the same level. It provides insight into relative value. Is the News section providing more business value that the Reference section?
For a horizontal comparison you need to make sure you are comparing similar levels and similar things. For example, you can compare different subject areas but not the contribution of a subject such as “Flu” to the performance of the site search application. In other words, make sure you are comparing apples to apples or or at least fruit to fruit, not apples to plywood.
Contribution can be an extremely helpful way to understand performance. Did one segment improve at the expense of another or was there a net gain? For example, let's say you launch an improvement to an application on your site. You see that it quickly shows 10% more page views. Great! But wait. You see that your site did not grow overall. It stayed the same. (This is actually quite common.) You have shifted some of your existing audience to your new application from somewhere else on your site. By looking at the contribution of the other applications, you can see where the audience for your new application came from and then determine whether you have shifted your users to higher or lower value pages.
As with the segmentations noted in the previous section, you can trend contribution over time. Comparing the trends for similar things, you can see the interdependence of your site’s elements.
Contribution can also help you know where to invest resources and attention. For example, you may have a topic such as “Gerd” that generates very high page consumption. However, it contributes only a very small portion of your sites page views compared to other topics such as “Cancer” or “Flu”. Once identified, you can then look at the growth potential of Gerd and decide whether to spend dollars promoting it or whether the current Gerd dollars are better spent improving your high value Cancer section.
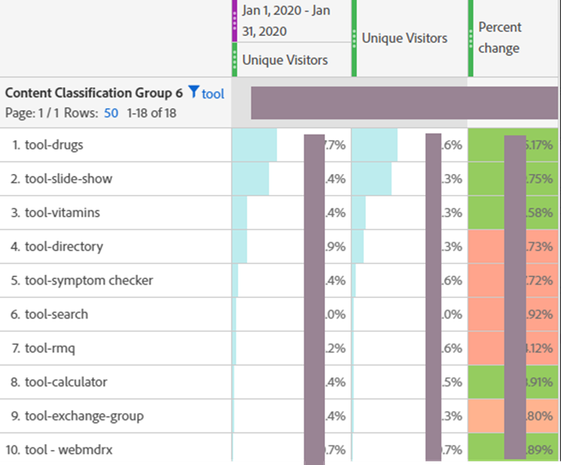
In the following example, we have multiple comparisons. The report shows a year over year (time based) comparison of a given site tool’s share of unique users. It also shows a “horizontal” comparison of the various site tools.
