
Making a Goal and Forecasting Report
I want to share how I created an advanced Goal/Forecasting report. A goal or a forecasting report is a monitoring type report. Creating a combined Forecasting and Goal Progress (or Goal Pacing) report is a valuable way to track your progress towards a specific goal over time and forecast your future progress. Such reports can be a useful tool for monitoring and making data-driven decisions.
To have goal tracking, you need a defined goal and a time period in which to achieve that goal. For example, the goal can be a target like the visitor guarantee for a sponsored program, or a traffic goal such as last year's page view count plus 10%. The time period could be a year or some other number of months or weeks.
In the following sponsorship example, there is an annual visitor goal, but the monthly goals are different for each month. I will explain what the report shows and then I will explain in detail how you can make the report. This is just an example. There are other metrics and visualizations one could use depending on your business. This one works for our business.
Notes:
- This work relies heavily on the blogs of several outstanding practitioners, primarily Frederik Werner and Andrey Osadchuk.
- The report is designed to be able to be built once per goal, without the need to maintain the report every month.
- In general, the report inputs are the time granularity (e.g., Month), the overall goal (e.g., Annual Unique Visitors), the target goal for each time period (e.g., Unique Visitors for each Month), and the Adobe metric (e.g., Unique Visitors).
- This example is for a monthly report, but it can be adapted to weekly or quarterly reporting. It can also be adapted for different metric goals such as PV or Visits or Orders.
- It took me a bit under 2 hours to build this report from scratch, once I figured it out. It takes me about 40 minutes to copy the report and modify it for a new program with the same time periods and metric.
- It’s easier to make this report in Report Builder/Excel than in Workspace. (I’d think Adobe could make a template that would make this sort of report easier.) But just the ability to do this in Workspace is awesome and showcases the tool's strength and versatility.
Report Overview
The screenshot below shows you the report:
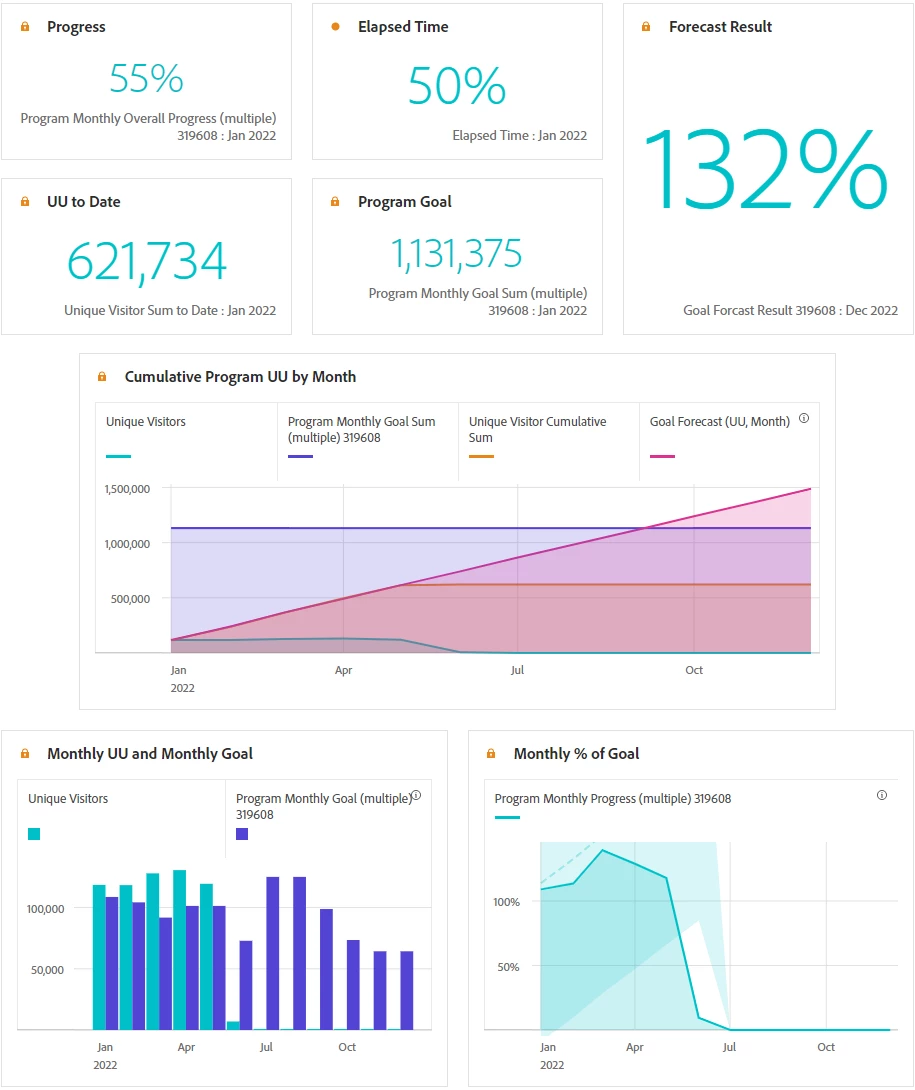
The first section shows you the overall goal and the progress to date toward that goal. The five tiles provide a snapshot of where you are in achieving your goal:
- The percentage complete to date. (This is the Unique visitors to date / the annual program goal).
- The percentage of elapsed time for the program. (This is the current month / total months in the program).
- The forecasted difference between the goal and the Unique Visitors at the end of the report period.
- Unique Visitors for the program to date.
- The annual goal.
This is followed by a trend graph that shows you how your pacing is doing over time by month. It also provides an estimate of the future activity based on performance to date. There are four trend lines:
- Unique Visitors to date (turquoise line).
- The goal (lavender line).
- Cumulative Unique Visitors (orange line). These are the summed monthly visitors to date deduped across months.
- The statistical Forecast (pink line) based on the Unique Visitors to date. The example forecasts an excess of UU by the end of the program period.
After that we have two more graphs. The one on the left shows the Monthly Unique Visitors vs. the goal by month. This bar chart makes it easy to see performance vs. target by month. Note that the goals for each month are different. The graph on the right shows a trended view of the % of the monthly goal achieved.
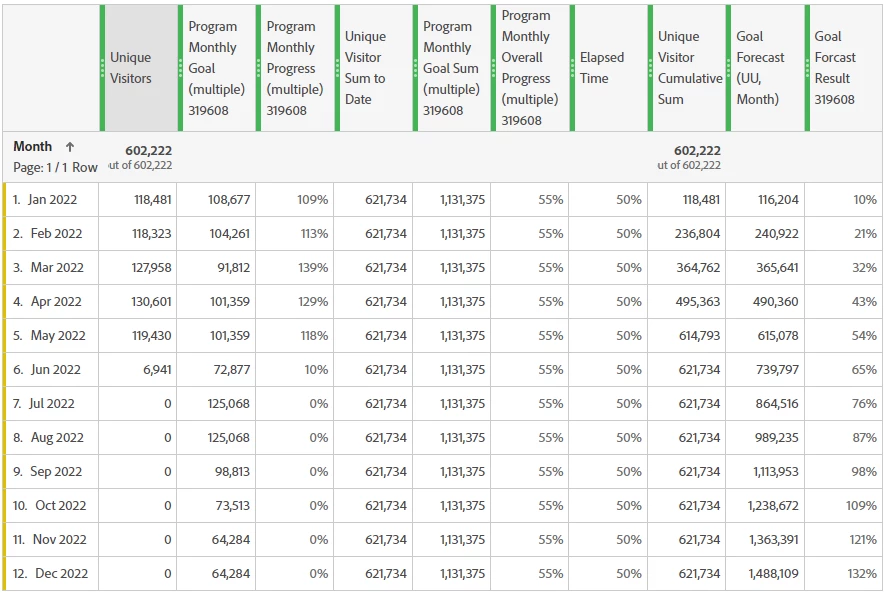
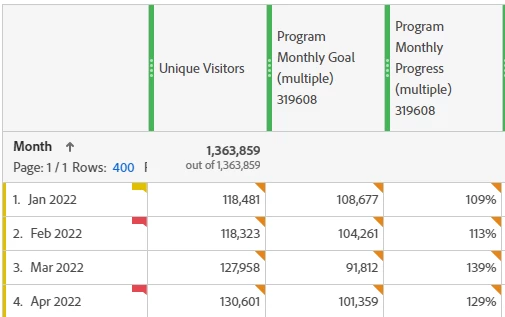
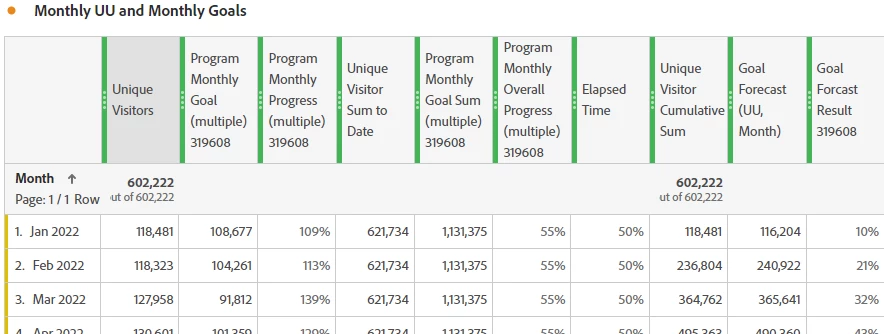
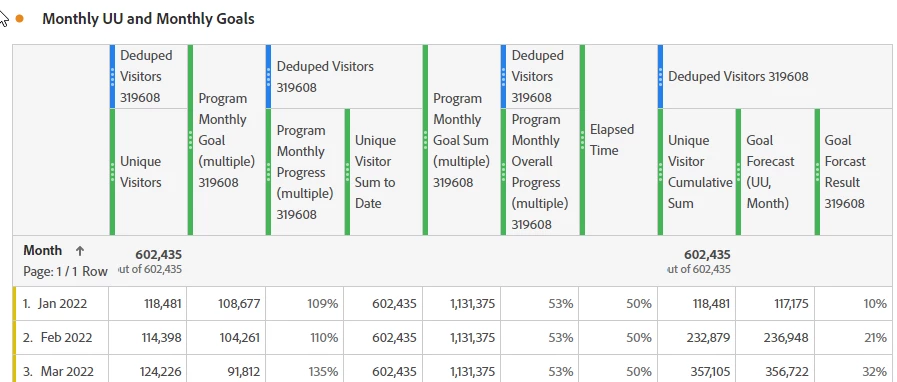
The visualizations above are all powered by the following monthly table. Building a single table is easier to create and copy for different sponsor programs rather than using multiple tables. All but the first metric column are custom calculated metrics.
- Unique Visitors. The first metric is just unique visitors.
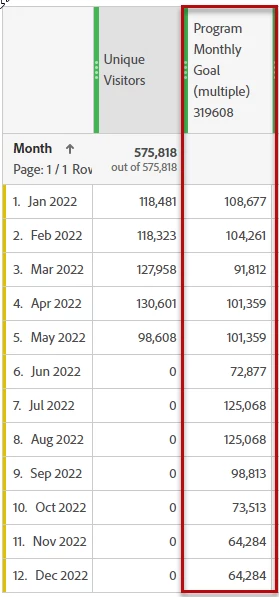
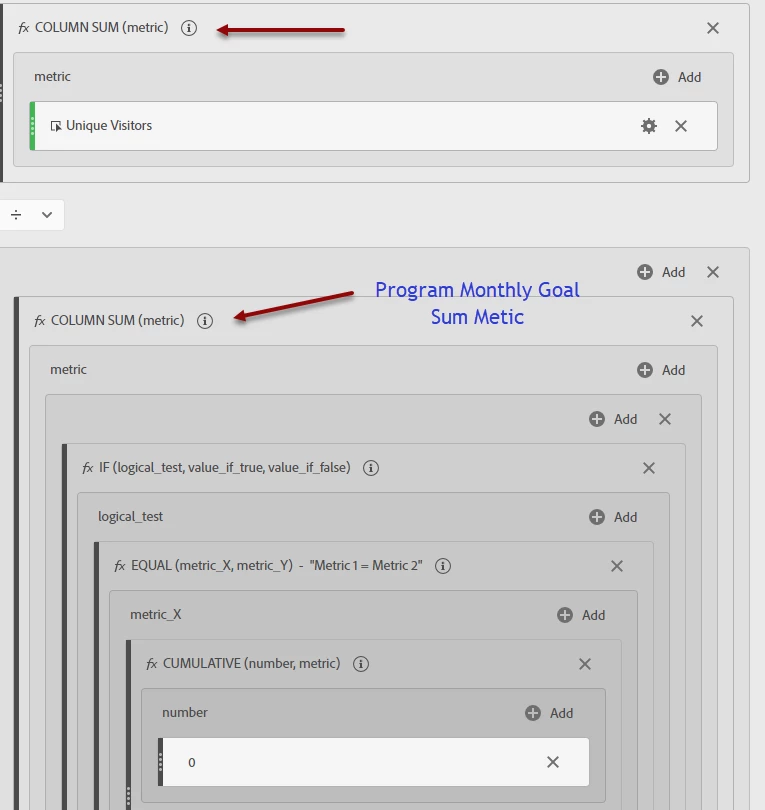
- Program Monthly Goals. The second metric is a calculated metric that enters the different goals for each month.
- Program Monthly Progress. The third metric shows you the % of goal completed for each month (109 % of goal for Jan).
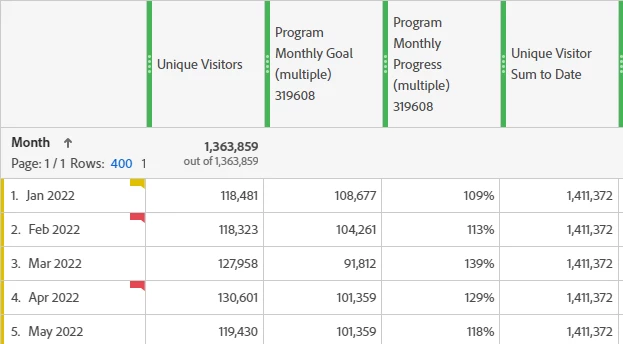
- Unique Visitor Sum to Date. The UU Sum to Date metric is the sum of the monthly Unique Visitors to date. This is deduped across months in the final report.
- Program Monthly Goal Sum. The fifth metric is the sum of the monthly goals.
- Program Monthly Overall Progress. The sixth metric is the % of goal completed for the program overall.
- The Elapsed Time is the seventh metric, showing the percentage of program duration completed to date.
- The metric Unique Visitor Cumulative Sum is the Monthly Unique Visitors for this month added to the visitors for the prior months. E.g., Jan, Jan+Feb, Jan+Feb+Mar, etc. This is the eighth metric.
- The 9th metric is Goal Forecast. This is a regression model that uses the data to date to create the forecast.
- Goal Forecast Result. The last metric is the difference between the forecast and the overall goal. The Dec number predicts that the program will be at 132% of the goal at the end of the program.
When the table sums, it currently adds unique visitors across months. However, in the given example, we are dealing with an annual goal. I will show you how to deduplicate visitors across months later.
This is a complicated table to look at and you may want to hide the table in the finished report, leaving just the visualizations. It depends on your intended audience.
Implementation
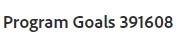
First title your dashboard. In this case, I used the title "Program Goals" and an identifier of the specific program. Naming conventions might be important if you have a lot of similar goals to track. Having a consistent naming convention makes it easier to find similar dashboards in your Workspace list. Example:
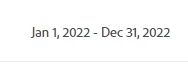
Next, set your date range for the report using the start and end dates of the goal. The range should be in whole months. In this example, a year.
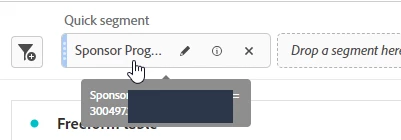
Then create a segment that captures the scope of the traffic contributing to the goal. In this case, I use the element in a variable representing the program name which is set on every page of the program.
Create the table
Note: I have tried to be explicit in showing the steps, so this instruction is going to be long. It will be helpful if you already have some experience creating calculated metrics.
First, drag a Freeform table into the Workspace. Drop the Month dimension into the left column.
Next create and add the metrics. There will be 10 metrics in the table. I have listed the steps for each one below:
- From the components bar, drag the Unique Visitors metric to the right of the date (second column). If the Occurrences metric is present, delete it.
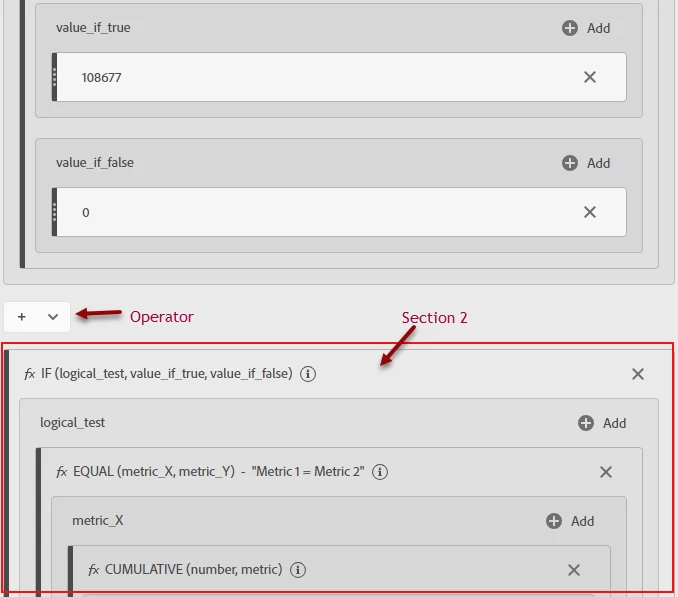
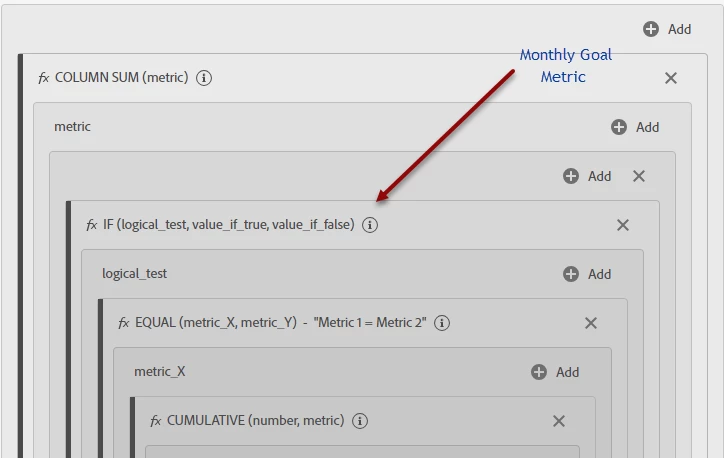
- Create the metric for the program monthly goal. We need to have a way to enter a custom goal for each month and associate that goal with the correct month in a single column. To do this we create a calculated metric that uses several built-in functions.
- Click the "+" sign next to the metric component to open the metric creator form.
- Name the metric. In this case I called it "Program Monthly Goal (multiple)" + the program number.
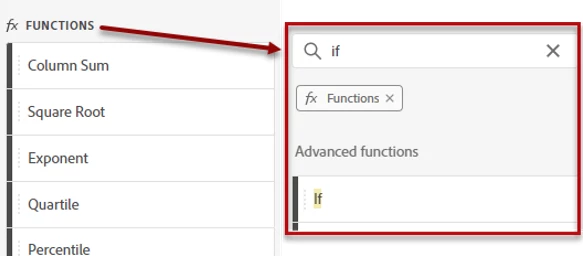
- In the components bar, click on the "Functions" label, then search for the "If" function.
- Drag the If function onto the “drop metrics” box.
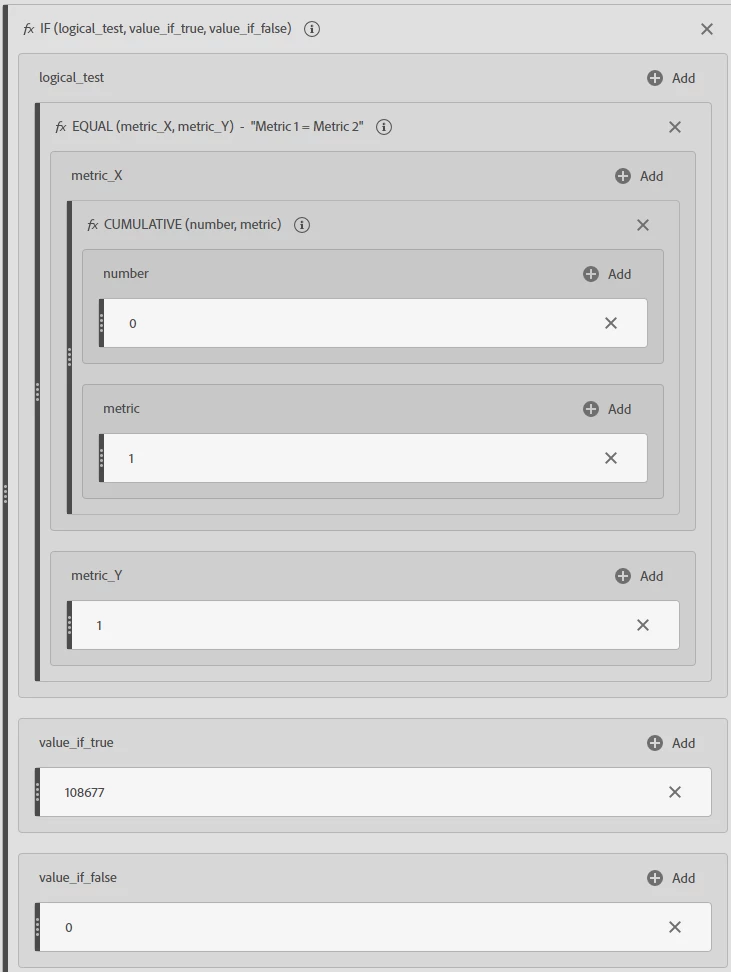
- Next search for the "Equal" function and drag it into the Logical_test box within the If function.
- Then search for the Cumulative function and drag it into the metric_x box within the Equal section. (The Cumulative function sets a row number to identify each month in the series.)
- In the Cumulative function set the number box to 0. This is the default so likely you will not actually need to set it. (This starts the counting at 0.)
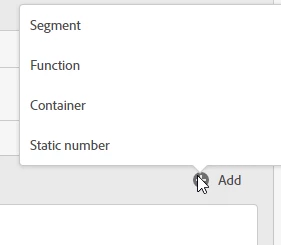
- Click "Add" on the "metric" box and select "Static Number". Enter "1" as the number. (This is the amount the Cumulative function will add for each row and will correspond to the monthly rows.)
- Then, in the Equal section, set "metric_Y" to 1 using a Static number. (metric_Y identifies a given month, (the first month in this case.)
- In the If function section, set the "value_if_true" to the first month's goal using a Static number.
- Set the "value_if_false" to 0 using a Static number. (The false box is at the bottom).
- The metric builder should now look like the following:
So far, you have used the Cumulative function to number each month in the trended series. You used the Equal function to ask if the month number is 1 (metric_y). If so (the If logic function) set the value_if_true, which is the monthly goal. If not it sets no value. In other words, if the value is Jan (month 1) then set the value to your goal (value_if_true). - Next, repeat this all for the next month. Follow the steps above for each month, but set the metric_Y value to 2 (meaning the second month), and the value-if-true to the second month's goal.
- Change the metric operator between the sections for the first and second months from divide to "+"
- Repeat this for all the remaining months in the series. There will be 12 sections (one for each month), each section should be separated with an add sign: "+".
- Click Save.
- Drag the metric from the components bar to the table's third column.
- The metric columns will look something like this so far:
Note: Once you build this, you only need to duplicate the completed metric and change the monthly goal numbers for a new goal report. Also, if you have fewer than 12 months for a new goal range, you do not need to remove the extra months. Workspace will just ignore the extra months in the metric when you select a shorter calendar range. - Create the metric to show the program monthly progress. This shows you the % of goal achieved for each month. It is simply Unique Visitors divided by the Monthly Goal.
- Click the "+" sign next to the metric components to open the metric creator form.
- Name the metric. In this case I called it "Program Monthly Progress" + the program number.
- Drag and drop Unique Visitors onto the “drop metrics” box. Then drag the Program Monthly Goal metric that you just created to just below the Unique Visitors metric. Check to be sure the divide icon is between them (divide is the default setting).
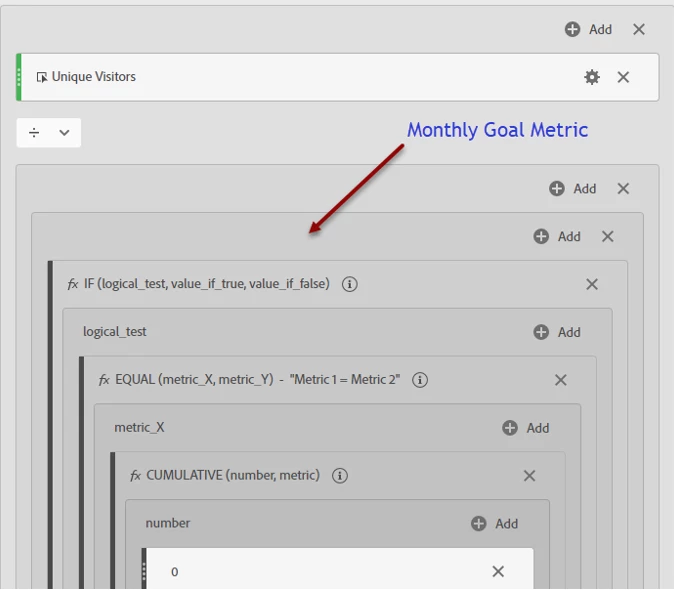
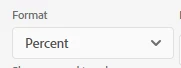
- In the format box, select "Percent" from the drop-down box.
- Click Save.
- Drag the metric from the components bar to the table's fourth column. Your table should look something like this:
- Create the metric to show the unique visitor sum to date to date. This provides a single number to show the added monthly Unique Visitors to date. It is the same number for each monthly row as it is the total to date not the total for a month. (As noted above, I will show you how to dedupe the visitors later.)
- Click the "+" sign next to the metric component to open the metric creator form.
- Name the metric. In this case I called it " Unique Visitor Sum to Date”.
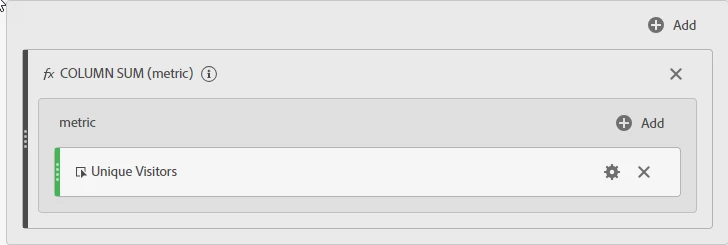
- In the components bar, click on the "Functions" label, then search for the "Column Sum" function.
- Drag the Colum Sum function onto the 'drop metrics' box.
- Then drag the Unique Visitors segment into the metric box.
- Drag and drop the "Unique Visitor Sum to Date" metric to the table's fifth column.
- Create a metric that shows program monthly goal sum. This provides a single number to show the total of the monthly goals. It is the total program goal so the number is the same for each month row.
- Click the "+" sign next to the metric components to open the metric creator form.
- Name the metric. In this case I called it "Program Monthly Goal Sum (multiple)" + the program identifier.
- In the components bar, click on the "Functions" label, then search for the "Column Sum" function.
- Drag and drop Column Sum to the “drop metrics” box.
- Then drag the “Program Monthly Goal” metric into the Column Sum drop box. This is the one you already created above under item 2.
- Click Save.
- Drag the metric from the components bar to the table's sixth column.
- Create a metric that shows the program monthly overall progress of the program to date. This shows the percent complete to date for the goal metric. It is calculated by the sum of Unique Visitors to date divided by the sum of monthly goals. It is the same number for each monthly row.
- Click the "+" sign next to the metric components to open the metric creator form.
- Name the metric. In this case I called it "Program Monthly Overall Progress (multiple)" + the program identifier.
- In the components bar, click on the "Functions" label, then search for the "Column Sum" function.
- Drag and drop Column Sum to the “drop metrics” box.
- Then drag the Unique Visitors metric into the Column Sum drop box.
- Drag the “Program Monthly Goal Sum” metric you create above to just below the Column Sum Box. The division operator should be between the two sections.
- Click Save.
- Drag the metric from the components bar to the table's seventh column.
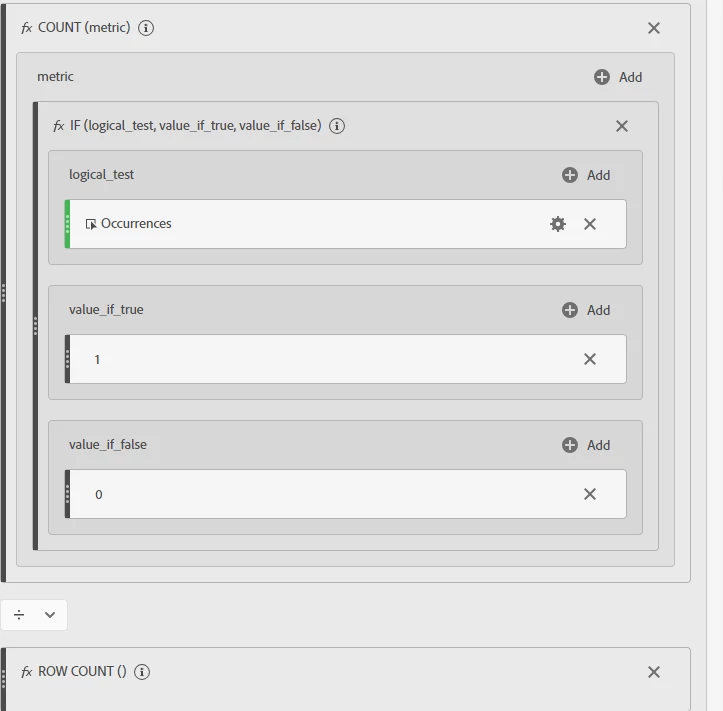
- Create the Elapsed Time metric. This counts the number of time periods in the report to date, months in this example, divided by the total number of time periods, 12 in this example. As it is the total elapsed time, the number is the same for each monthly row.
- Click the "+" sign next to the metric components to open the metric creator form.
- Name the metric. In this case I called it "Elapsed Time”.
- In the components bar, click on the "Functions" label, then search for the "Count" function.
- Drag and drop the “Count” function to the “drop metrics” box.
- In the components bar Function section, search for the “If” function.
- Drag the “If” function into the metric box within the Count function.
- In the logical_test box drag in the occurrences metric.
- Click "Add" on the "value_if_true" box and select "Static Number". Enter "1" as the number.
- Click "Add" on the "value_if_false" box and select "Static Number". Enter "0" as the number.
- Then, underneath this section, drag in a new function called “row count”. Be sure to set the operator between the two sections to divide.
- Drag and drop the "Elapsed Time" metric to the table's eighth column.
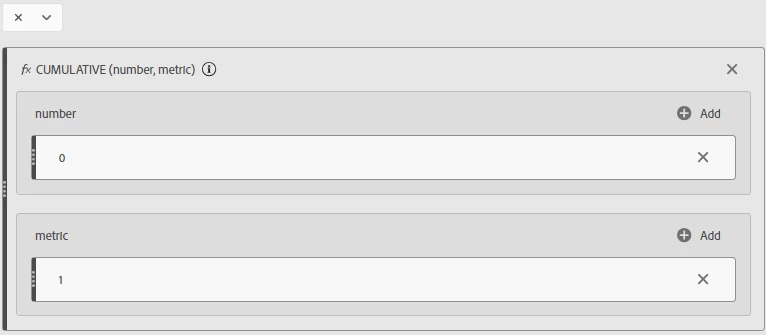
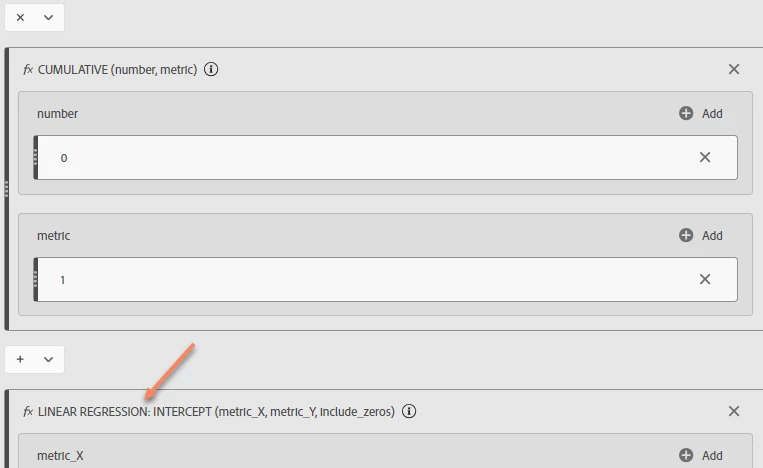
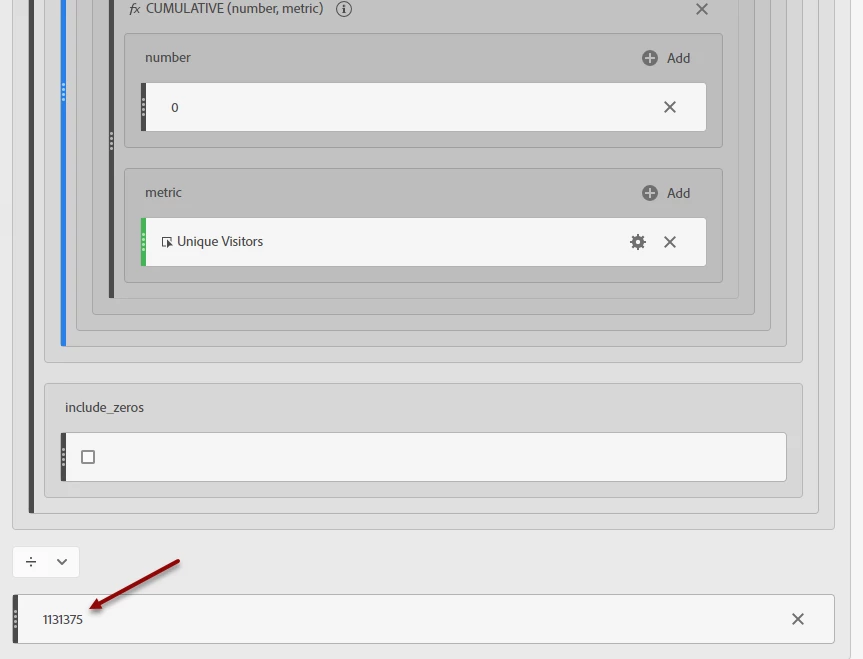
- Create the metric to show the unique visitors cumulative sum. This provides the Unique Visitors for the current month added to the Unique Visitors for the prior months. E.g. for month 4, this would be UU for month 1 + UU for month 2 + UU for month 3 + UU for month 4. We will dedupe these visitors across months later.
- Click the "+" sign next to the metric components to open the metric creator form.
- Name the metric. In this case I called it "Unique Visitors Cumulative Sum”.
- In the components bar, click on the "Functions" label, then search for the "Cumulative" function.
- In the “number” box, click on "Add" and select "Static Number". Enter "0" as the number.
- In the metric box drag in Unique Visitors.
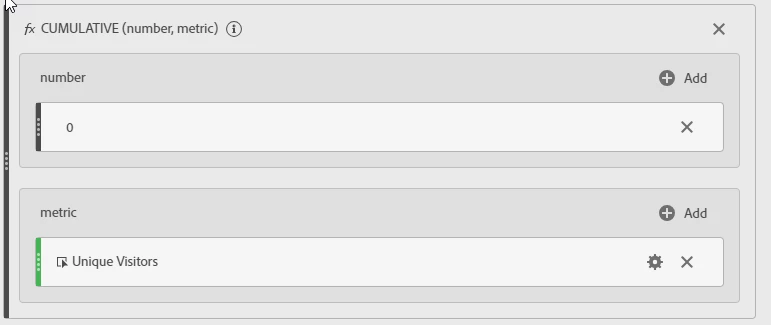
- Click save.
- Drag and drop the "Unique Visitor Cumulative Sum to Date" metric to the table's ninth column.
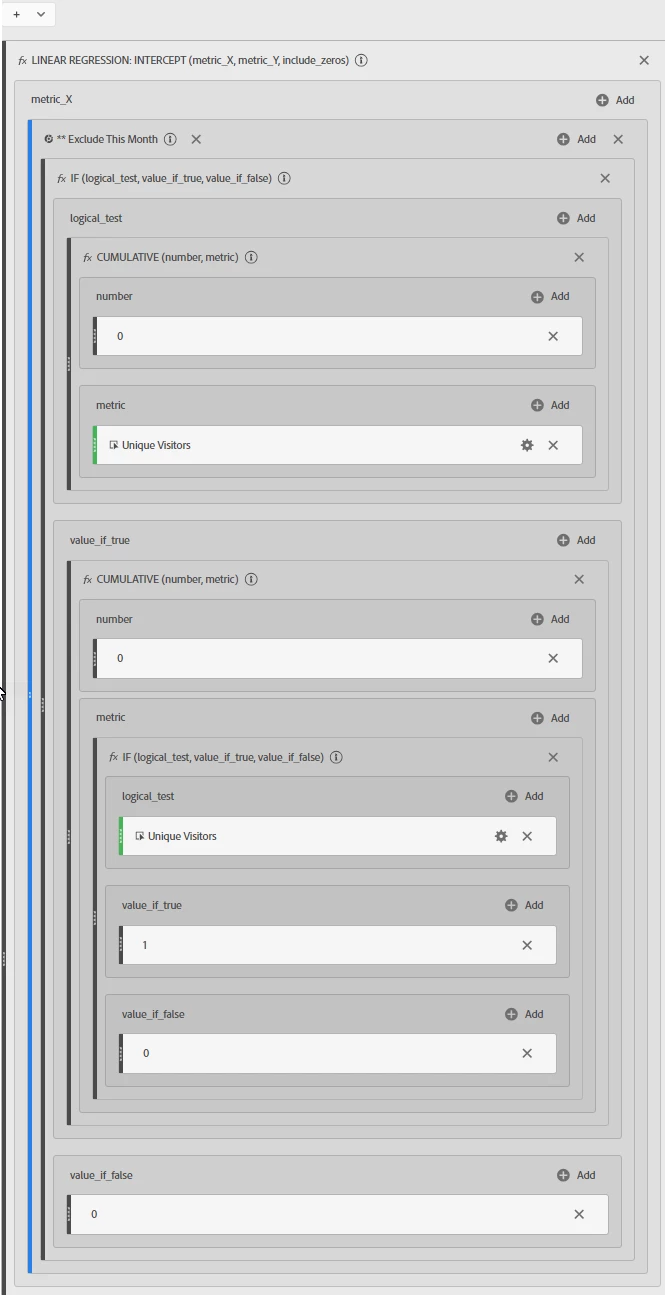
- Create the metric for the Goal Forecast. This provides a statistical forecast of traffic based on the traffic to date. It uses the “Linear Regression: Slope” and “Linear Regression: Intercept” functions to create a standard linear forecast. (Note: Workspace also has Log, Power, Quadratic, Reciprocal, and Exponential functions that you can use, depending on what best fits your data. You can ask your statistics guy for help with these.)
- Drag in the “Exclude This Month” segment into the metric_x section.
- In the components bar Function section, search for the “If” function.
- Drag the “If” function into the metric box for Exclude This Month.
- In the logical_test_if_false box, click on "Add" and select "Static Number". Enter "0" as the number.
- In the logical_test_if_true box drag in the Cumulative function (from the components bar in the Function section).
- In the “number” box, click on "Add" and select "Static Number". Enter "0" as the number.
- Drag the metric Unique Visitors into the "metric" box.
- In the “If” function value_if_true box, drag in the Cumulative function (from the components bar in the function section).
- In the “number” box, click on "Add" and select "Static Number". Enter "0" as the number.
- In the metric box, drag in another “If” function.
- In that new if section, drag in the metric Unique Visitors into the logical_test box.
- In the value_if_true box, click on "Add" and select "Static Number". Enter "1" as the number.
- In the value_if_false box, click on "Add" and select "Static Number". Enter "0" as the number.
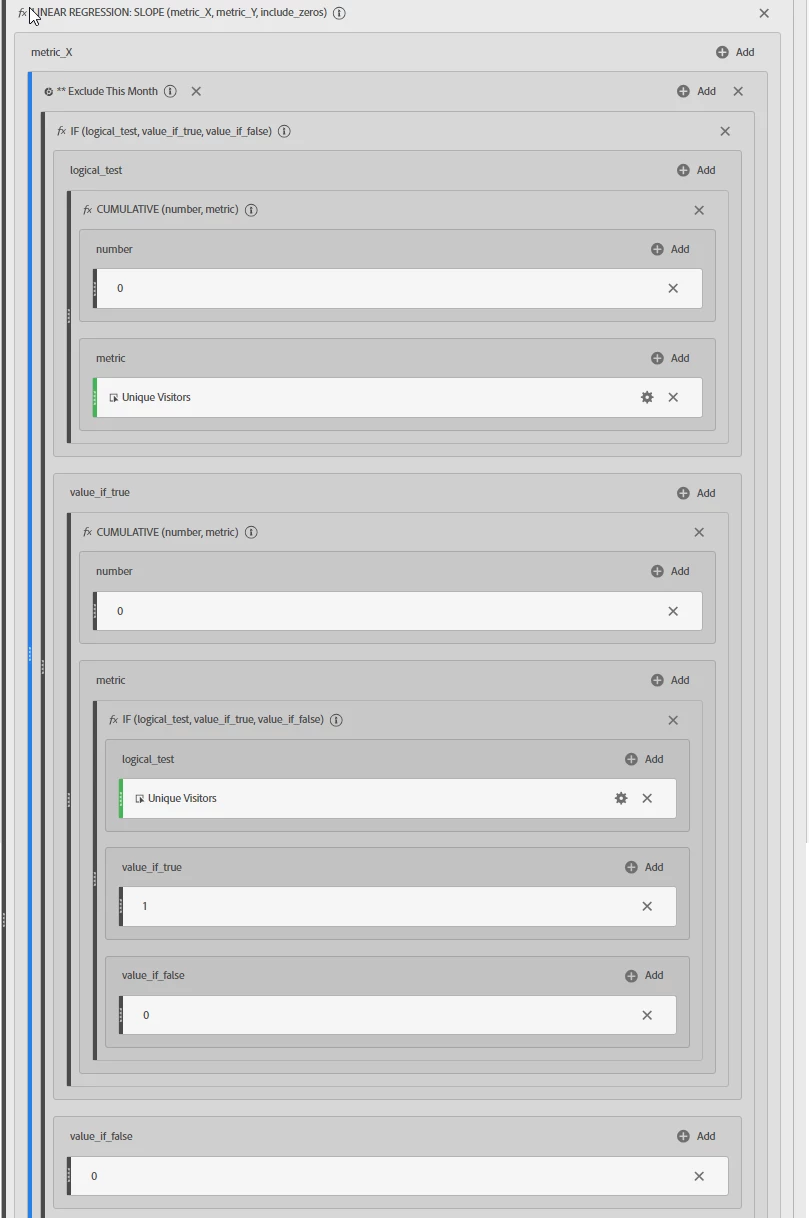
- Drag in the “Exclude This Month” segment into the metric_y section.
- In the components bar Function section, search for the “Cumulative” function.
- Drag the “Cumulative” function into the metric box for Exclude This Month.
- In the “number” box, click on "Add" and select "Static Number". Enter "0" as the number.
- In the “metric” box, drag in the metric Unique Visitors.

- Drag in the “Exclude This Month” segment into the metric_x section.
- In the components bar Function section, search for the “If” function.
- Drag the “If” function into the metric box for Exclude This Month.
- In the logical_test_if_false box, click on "Add" and select "Static Number". Enter "0" as the number.
- In the logical_test_if_true box drag in the Cumulative function (from the components bar in the Function section).
- In the “number” box, click on "Add" and select "Static Number". Enter "0" as the number.
- Drag the metric Unique Visitors into the "metric" box.
- In the function value_if_true box, drag in the Cumulative function (from the components bar in the Function section).
- In the “number” box, click on "Add" and select "Static Number". Enter "0" as the number.
- In the metric box, drag in another “If” function.
- In that new if section, drag in the metric Unique Visitors into the logical_test box.
- In the value_if_true box, click on "Add" and select "Static Number". Enter "1" as the number.
- In the value_if_false box, click on "Add" and select "Static Number". Enter "0" as the number.
- Drag in the “Exclude This Month” segment into the metric_y section.
- In the components bar Function section, search for the “Cumulative” function.
- Drag the “Cumulative” function into the metric box for Exclude This Month.
- In the “number” box, click on "Add" and select "Static Number". Enter "0" as the number.
- In the “metric” box, drag in the metric Unique Visitors.
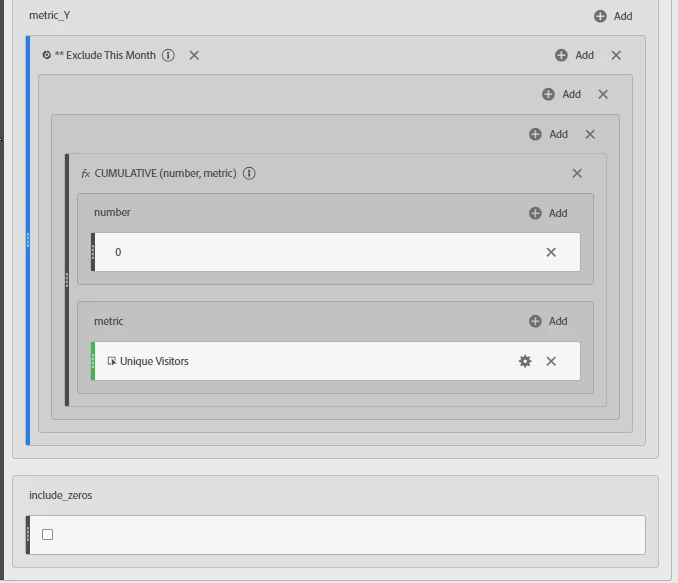
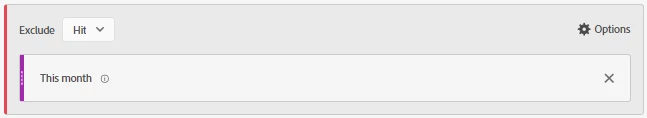
- You will need to create a segment to limit the scope of this work to the full month. A partial month’s data makes the statistical forecast by month go wonky. Create a hit based exclude container and drag in the “This Month” date element. I called the segment “Exclude This Month”. We will use this shortly.
- Click the "+" sign next to the metric components to open the metric creator form.
- Name the metric. In this case I called it "Goal Forecast (UU, Month)”.
- In the components bar, click on the "Functions" label, then search for the "Linear Regression: Slope" function.
- Drag and drop the “Linear Regression: Slope” function to the “drop metrics” box. This looks for two values, metric x and metric y.
- For Metric x:
- For Metric y:
- Next, you are going to multiply all the above by a cumulative number. Search for the Cumulative function in the Function components section.
- Drag the Cumulative function underneath the Linear Regression: Slope function.
- Set the operator to Multiply.
- In the number box, click on "Add" and select "Static Number". Enter "0" as the number.
- In the metric box, click on "Add" and select "Static Number". Enter "1" as the number.
- Under the Function section of the Components bar, search for “Linear Regression Intercept.”
- Drag the “Linear Regression Intercept” function under all of the above. Set the operator to plus.
- This function looks for two values, metric x and metric y.
- Metric x:
- Metric y:
- Click save.
- Drag and drop the "Goal Forecast" metric to the table's tenth column.
- Create a metric for the goal forecast result. This shows you the forecast for how much of your goal you are predicted to achieve. This is calculated by the forecasted traffic divided by the total goal.
- Click the "+" sign next to the metric components to open the metric creator form.
- Name the metric. In this case I called it "Goal Forecast Result" + the program number.
- Drag the "Goal Forecast” metric you created above into the “drop metrics” box.
- Click the topmost "Add" icon and select "Static number".
- Scroll to the bottom and add the annual Visitors goal.
- Click Save.
- Drag the metric from the components bar to the table's eleventh column.
Your table should now look something like this:
Deduping Unique Visitors Across Months
In the method listed above, the cumulative monthly values are added across months. A visitor coming in Jan and Feb would be counted twice. You can also configure the report to de-dupe the cumulative Unique Visitors across months. That Jan-Feb visitor would only be counted once.
The screenshot below shows added monthly unique users on the left, while on the right it shows the monthly unique users deduped across months. In the deduped example, the second line (232,879) shows the unique users minus those users who also came in the first line (118,481).
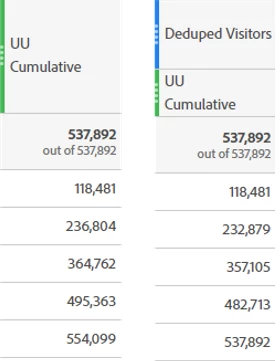
This deduping technique uses Segments and the specific variable you are tracking in your goal.
- In the components section, select the "+" next to "Segments" to open the segment creator form.
- Name the segment. In the example I called it "Deduped Visitors" + the program number.
- In components, search for your variable, in my example Sponsor Program/Activity. Then using the right facing chevron, select the data element that identifies the program. Drag it to the "drop box".
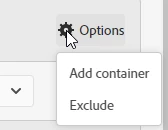
- Next, select the gear icon and "Add container".
- Drag the same variable into the new container twice.
- Change the connection operator between them to "Then" (in the new container).
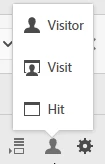
- Change the Hit selector in the new container to a Visitor.
- Select the gear icon in the new container and click "Exclude".
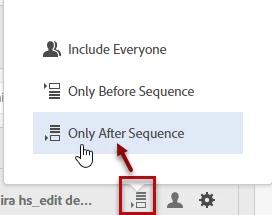
- Select the ladder icon and choose "Only After Sequence".
- Select "Save".
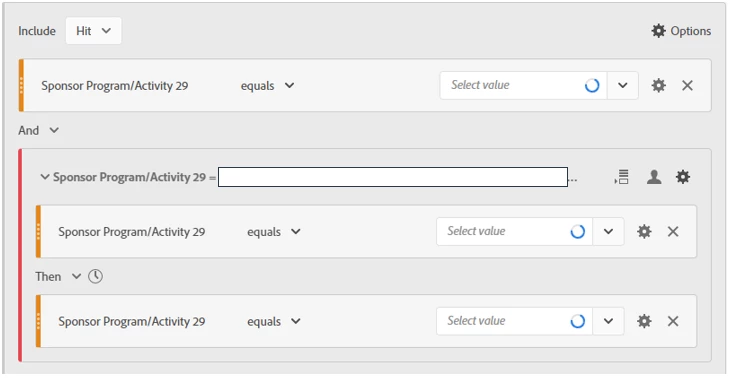
The segment will look like the following:
Now that you have created the segment, drag the segment onto the monthly table you created and onto the columns you want to cumulatively dedupe. In our example, the table would look like the following:
Create the visualizations
There are seven visualizations in this example. Now that the table is created, you can create the visualizations.
- For the Unique Visitors to Date tile:
- Double-click the Unique Visitors column.
- Then right click the column header.
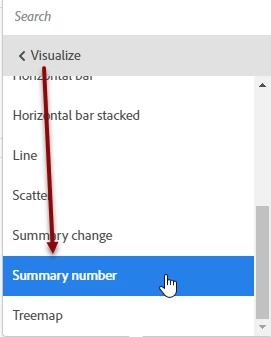
- Scroll down to the Visualize option and click it.
- Select "Summary Number"
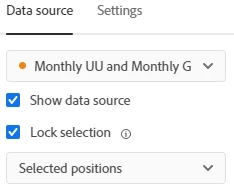
- On the tile click the gear icon > Data source. Then select "Lock selection" and, from the drop down, "Selected Positions". This will lock the visualization to the selected data.
- Change the label on the tile by clicking on the default label. In the example I renamed it "UU to Date".
- For the Goal tile:
- Double-click the "Program Monthly Goal Sum" column.
- Right click the column header.
- Scroll down to the Visualize option and click it.
- Select "Summary Number"
- On the tile click the gear icon > Data source. Then select "Lock selection" and, from the drop down, "Selected Positions".
- Change the label on the tile by clicking on the default label. In the example I renamed it "Program Goal".
- For the Goal Progress % tile:
- Double-click the "Program Monthly Overall Goal Progress” column.
- Right click the column header.
- Scroll down to the Visualize option and click it.
- Select "Summary Number"
- On the tile click the gear icon > Data source. Then select "Lock selection" and, from the drop down, "Selected Positions".
- Change the label on the tile by clicking on the default label. In the example I renamed it "Progress".
- For the Elapsed Time % tile:
- Double-click the "Elapsed Time" column.
- Right click the column header.
- Scroll down to the Visualize option and click it.
- Select "Summary Number"
- On the tile click the gear icon > Data source. Then select "Lock selection" and, from the drop down, "Selected Positions".
- Change the label on the tile by clicking on the default label. In the example I renamed it "Elapsed Time".
- For the Forecast Difference tile:
- Double-click the "Program Monthly Overall Goal Progress" column.
- Right click the column header.
- Scroll down to the Visualize option and click it.
- Select "Summary Number"
- On the tile click the gear icon > Data source. Then select "Lock selection" and, from the drop down, "Selected Positions".
- Change the label on the tile by clicking on the default label. In the example I renamed it "Progress".
Once the tiles are created, resize and drag them so they are above the table. - For the Trended Forecast visualization:
- Unique Visitors
- Program Monthly Goal
- Program Monthly Goal Sum
- Unique Visitor UU Cumulative Sum
- Goal Forecast (UU, Month)
- Double click the following columns while holding down the Ctrl key. Double clicking selects the columns:
- Right click the Unique Visitors header.
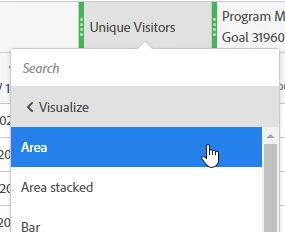
- Scroll down to the Visualize option and click it.
- Select "Area"
- On the visualization click the gear icon > Data source. Then select "Lock selection" and, from the drop down, "Selected positions". This will lock the visualization to the selected data.

- Change the label on the visualization by clicking on the default label. In the example I renamed it "Cumulative Program UU by Month".
- For the Monthly Goal Comparison between actual traffic and goal:
- Unique Visitors
- Program Monthly Goal
- Double-click the following columns while holding down the Ctrl key. Double clicking selects the columns.
- Right click the Unique Visitors header.
- Scroll down to the Visualize option and click it.
- Select "Bar"
- On the visualization click the gear icon > Data source. Then select "Lock selection" and, from the drop down, "Selected position". This will lock the visualization to the selected data.
- Change the label on the visualization by clicking on the default label. In the example I renamed it "Monthly UU and Monthly Goal".
- For the Monthly % of Goal chart:
- Double-click the "Program Monthly Progress" column.
- Right click the column header.
- Scroll down to the Visualize option and click it.
- Select "Area"
- On the visualization click the gear icon > Data source. Then select "Lock selection" and, from the drop down, "Selected position". This will lock the visualization to the selected data.
- Change the label on the visualization by clicking on the default label. In the example I renamed it "Monthly % of Goal"
In Conclusion
If you have gotten this far, congratulations. It is a lot to absorb. The report uses lots of different Workspace functionalities in combination. (As I said earlier, it’s probably easier to do this in Report Builder/Excel.) I have heard from Adobe’s Ben Gains that that Adobe is working on (or at least contemplating) their own version of a forecasting tool, but I do not know what form that might take. In the meantime, with time and patience, you can build your own with Workspace.