

More Than Creative Factories: 3 Techniques to Engage Your Designers in Analytics
Digital Analysts, if there are other members of your team often neglected in the analytics workflow, those are your designers— whether graphic, web, or UI/UX, they are key players and would benefit from your insights and analytics recommendations too.
All in a day’s work as a digital analyst involves a bunch of collaboration with your digital marketing, ecommerce, as well as commercial and operations team. But step back and you’ll see that your design department is more than just a creative factory.
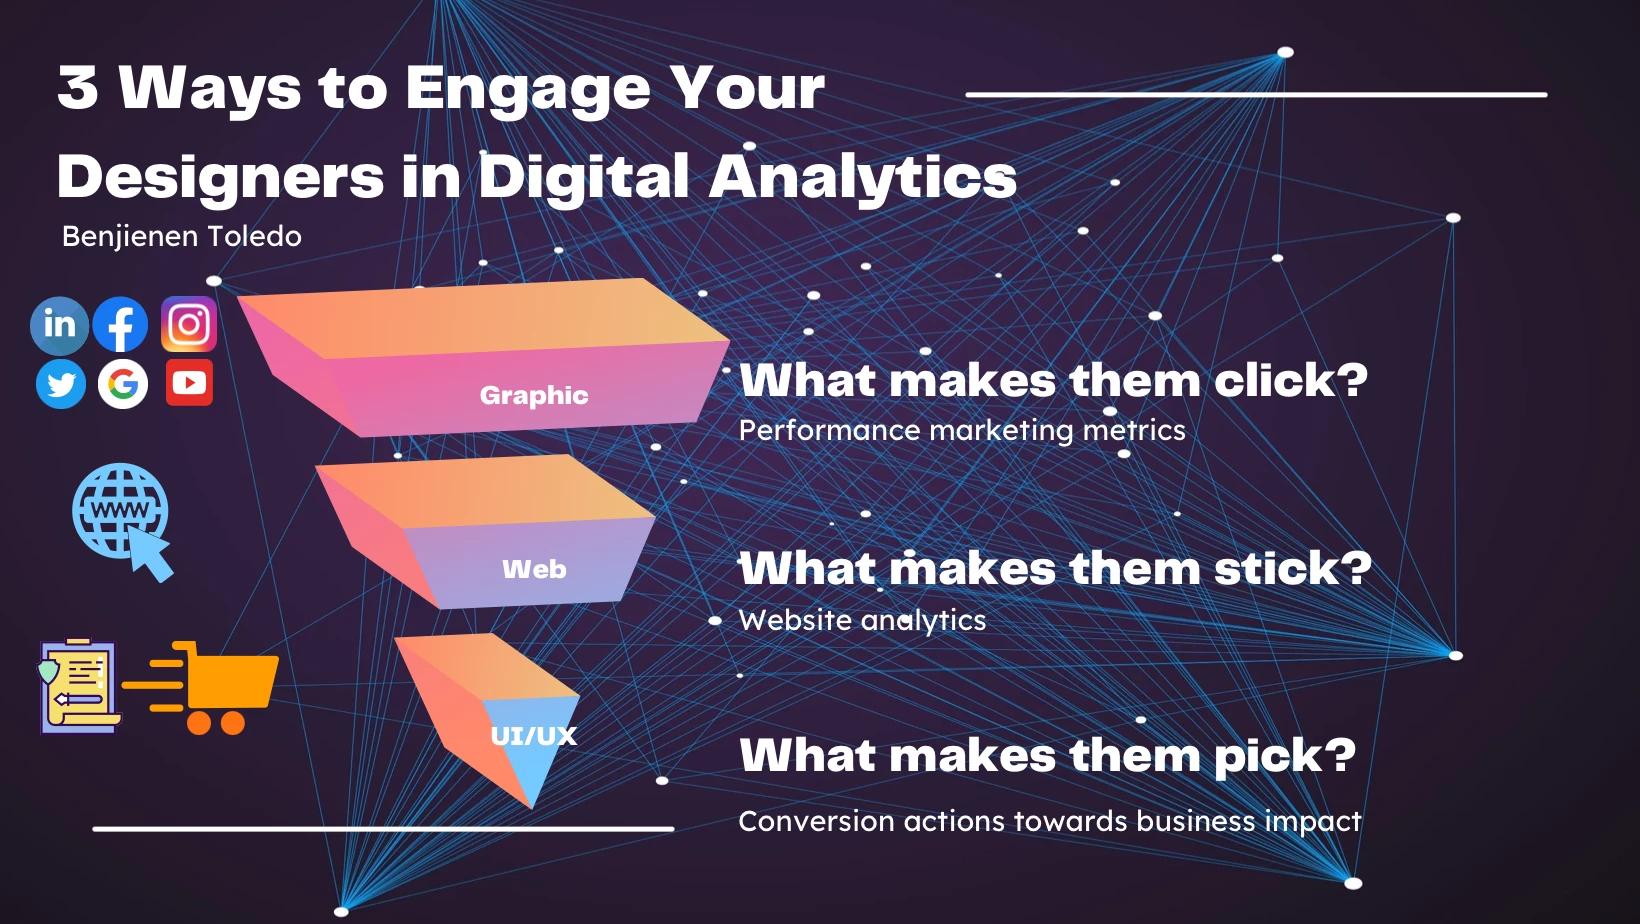
Here are three ways to engage your designers and how to structure and qualify your data for the right-brained people in your team.
1. Graphic Designers: What makes users click?
Your graphic designers make the lasting first impression with your audiences. Banner ads, marketing collaterals, social media, and other creative assets that you invest are fashioned by their creativity.
Engaging them takes more than just letting them know that creative A has the best clickthrough rate (CTR), while creative B sucks. Video X had the highest View Through Rate (VTR) while Video Y hardly made it. Embedding data–driven culture in your organization requires intentionality. And in the essence of mentoring, bring your designers through significant factors that influence creative performances.
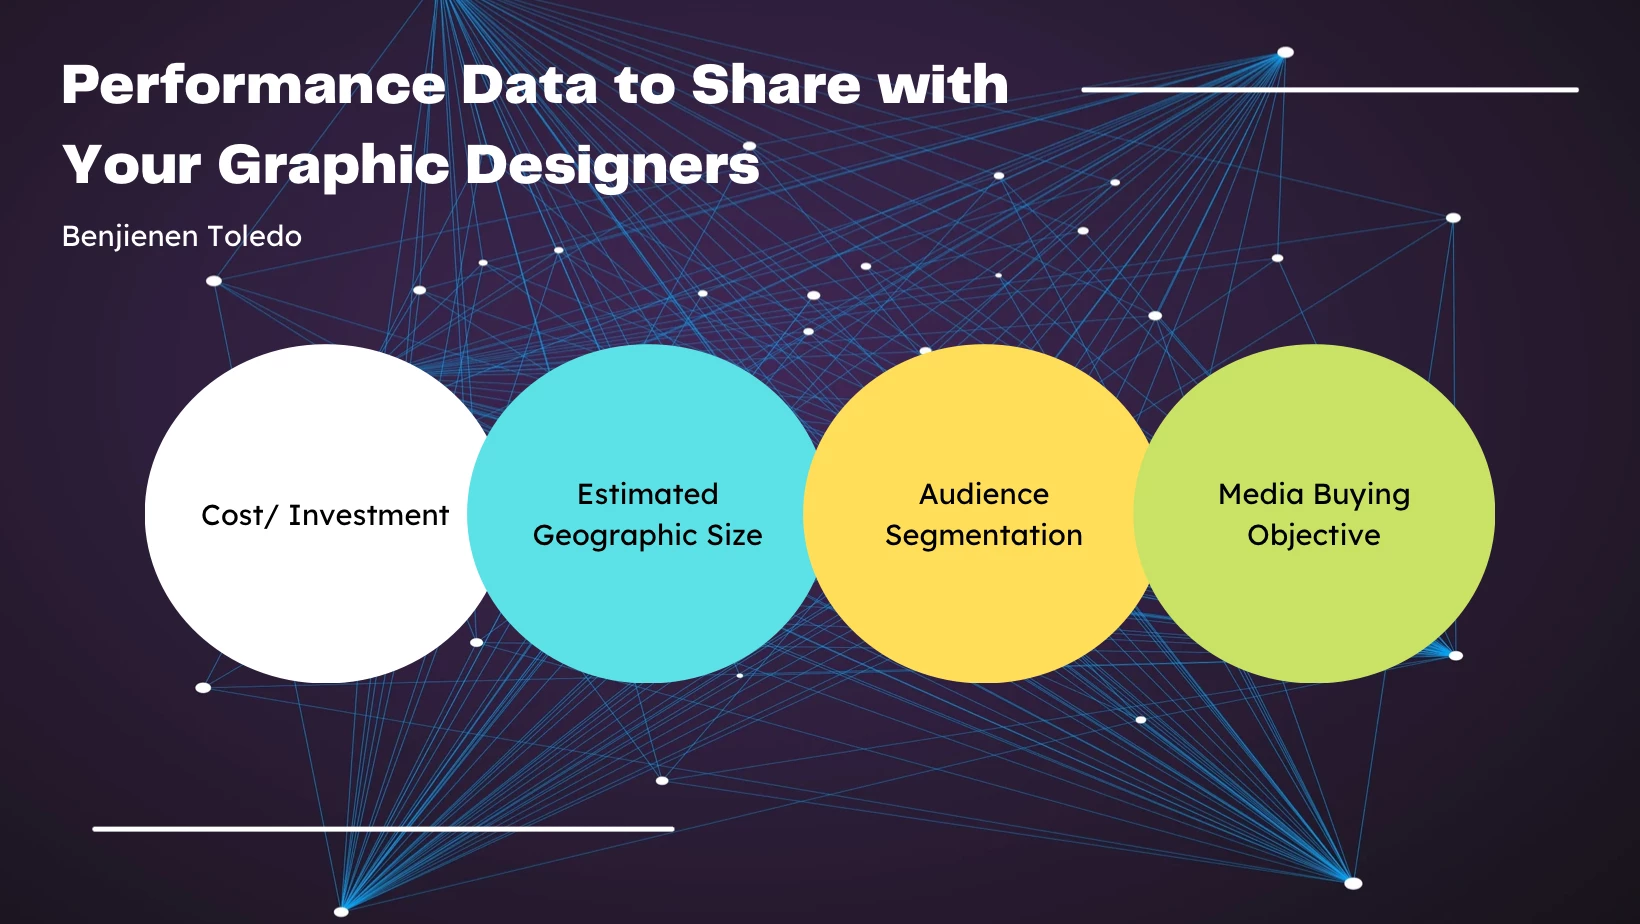
Performance Data to share with them and why:
a. Cost or Investment
This will affect individual creative’s reach and impressions received. Hence, a graphic ad may only be seen by few people and receive minimal clicks and low CTR is not just because it was designed poorly.
b. Estimated Geographic Size
Creatives used in various geography will yield differing performance results too. Naturally, a creative targeted to a location with only 20,000 estimated size will have lower impressions and potentially higher CTR than an ad targeted to a country with over 1M reach. The latter will potentially have very high impressions but lower clicks, hence, CTR below the target.
c. Audience Segmentation
In cases when you target multiple audience segments, a creative will resonate better to one audience but will perform poorly to the other. That’s why you must also give feedback to your graphic designers on which creative has higher CTR among decision influencers for example, and which one is outstanding for decision makers.
d. Media Buying Objective
Lastly, media buying objective will make or break a creative performance. An ad optimised towards cost per thousand impressions (CPM) will likely have high impressions and efficient CPM but lower clicks/CTR. Vice versa, the same ad that your digital marketers used to generate the best cost per click (CPC) or higher CTR may have more expensive CPM.
What I always advise our designers, is that they cannot expect strawberries if digital marketers paid for grapes.
But without giving them sufficient context on all the above, they will keep guessing what they did perfectly to replicate the same, if not better results next time. Analysts may be too familiar with these jargons like the back of your hands, but to win as a team requires constant learning, not out of whim.
2. Web Designers: What makes users stick?
Aside from making the landing pages functional, easy to navigate, and aesthetically attractive, your web designers must also understand whether the product they designed resonates with the target audience. You may wonder whether this is necessary, they are working on the web anyway. But guess what, digital analysis is not part of their sprint. Moreover, analytics tools such as your Adobe Workspace may not even be one of the innumerable tabs opened in their desktops. It’s within your hands as the analyst to keep this feedback loop active.
From experience, unless facts and figures are presented to your web designers to tell them why something doesn’t work or needs improvement, they will believe that their webpages work perfectly as intended.
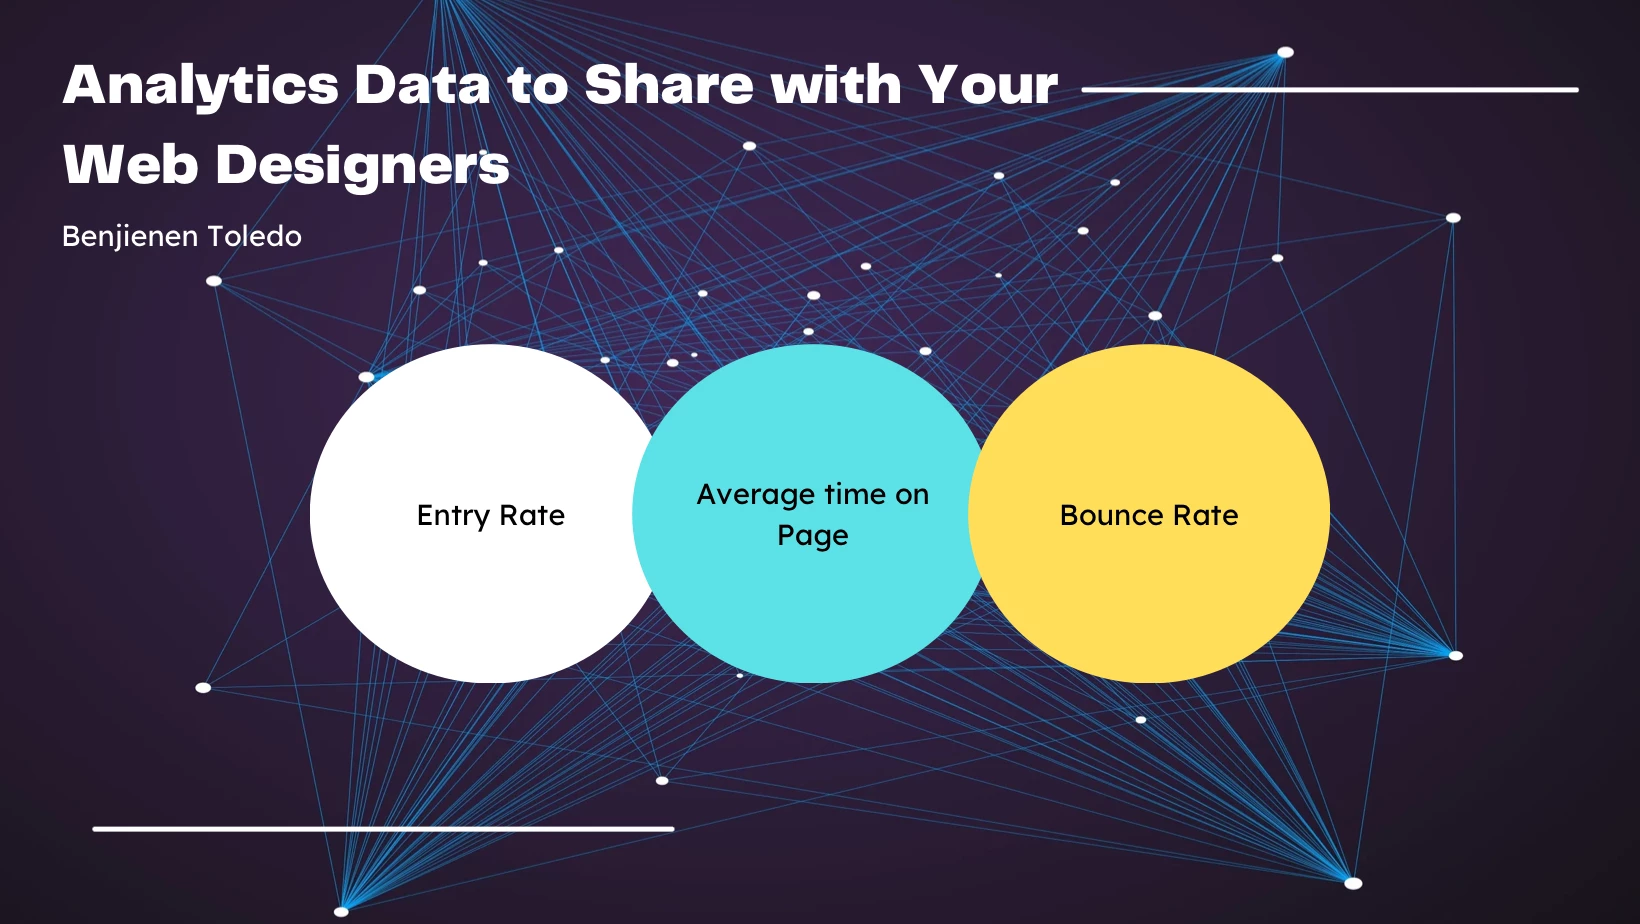
Insights and Analytics to share with your web designers and why:
a. Entry rate
So they may understand potential issues on the website loading speed that may have led the users to drop off even before the site has fully loaded.
b. Average time on page
So they can strategise how to reorganise content on your landing page. For example, your data shows that users only stay on a landing page for an average of 45 seconds, what information should be prioritised and brought above the fold (ABL). Time on page also helps your web designer streamline their workflow by eliminating unnecessary elements and improving efficiency to focus on what matters.
c. Bounce Rate
Double digit high bounce rate is not always despicable, but together with other factors that affect this metric, it is also good for your web designers to understand whether the high bounce rate was due to website layout, coding, etc. or whether there is a way to further optimise it.
3. UI/UX Designers: What makes users pick?
UX designers ensure that a product addresses the goals and needs of the users, they work with user interface (UI) designers, who design the visual aspects of an interface. Just like how HTML is a perpetual site on your web designers’ browser, Adobe Figma may be a permanent resident in your UI//UX designer’s screen—but not Adobe Analytics.
Users will act based on how they’ve experienced your website, whether it is intuitive, aligned with your ads, or consistent with the value that was promised. Ultimately, the part of the journey significantly influenced by your UI/UX designers is to answer the customers’ question whether “Are you worth a shot?”
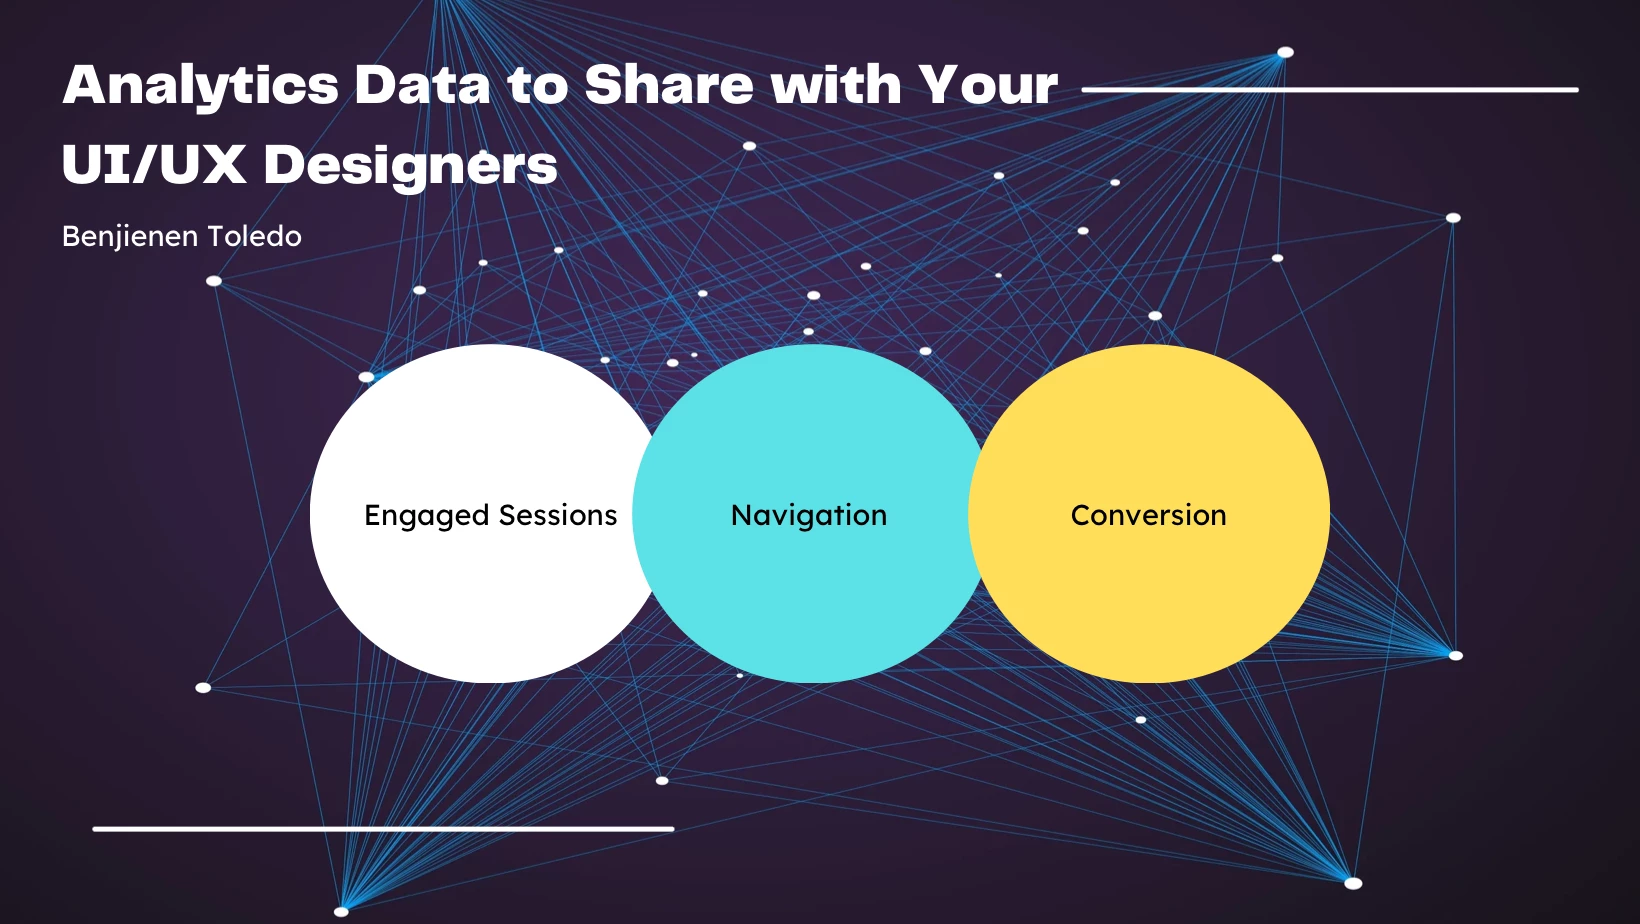
Insights and Analytics to share with your UI/UX designers include:
a. Engaged sessions
What catches the users’ attention when on your website? After they have stuck around, what other events can they trigger with the least friction?
b. Navigation
Where users go and how do they get there? How many interaction URLs or page paths are involved in each visit?
c. Conversion
What users do and how fast can they do it? Lastly, the most coveted outcome of a website visit is the eVars, especially U54v2.
Your designers need pragmatic inputs to amp their game and augment their artistry. Make the most of Adobe Analytics power to give actionable insights for you and the rest of your team. These will make the most of the business outcomes, cost efficient ad serving, and warrant that your team's design is not purely based on feelings, but supported by data.
All the best practices I summarised above will back you up in building better customer experiences. Be the reason your design team gains a second wind of confidence and another perspective on impactful design. All these will advance creative analytics.
Afterall, data and analytics stewardship must be more than just dashboards and reporting, be part of the digital transformation that you envision for your organisation.