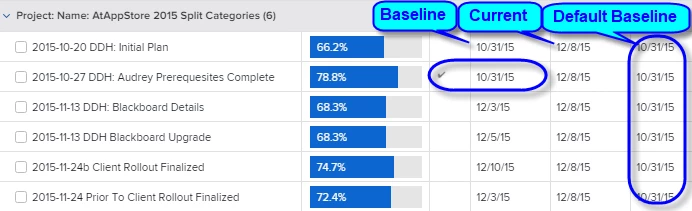
Project baseline report that shows specific baselines + the default baseline
Hi WF Community,
I'm trying to produce a project baseline report that shows any baselines where the name contains "extended" in it. In addition to showing these baselines, grouped by project, I also want to surface the Planned Completion Date for the baseline under each project that is marked as the default baseline.
Example:
Project A
- Extended Baseline 1 - 1/4/2024
- Extended Baseline 2 - 2/14/2024
- Extended Baseline 3 - 3/2/2024
- Default Baseline - 12/14/2023
I don't have to show the Default Baseline as it's own row, I really just want the Planned Completion Date value from it so people can compare the Extended baselines to it. I thought of adding a custom column to the report to show the Default Baseline's Planned Completion Date, but had no luck with this text mode:
displayname=Baseline 1
namekey=view.relatedcolumn
querysort=defaultBaseline:plannedCompletionDate
textmode=true
valuefield=defaultBaseline:plannedCompletionDate
valueformat=atDate
viewalias=defaultBaseline:plannedCompletionDate
I could create a custom field on the project level to house this value, but was trying to avoid creating a custom field.
Any ideas are welcomed.
Thanks,
Nick