Expand my Community achievements bar.

Submissions are now open for the 2026 Adobe Experience Maker Awards.
SOLVED

Missing JCR-SQL2 Queries from GraphQL Execution

Avatar

Level 2

I'm currently testing the performance of GraphQL queries in AEM. As part of the analysis using the Query Performance Analyzer, I'm attempting to capture the underlying JCR-SQL2 queries from the QueryStats section in the AEM System Console.

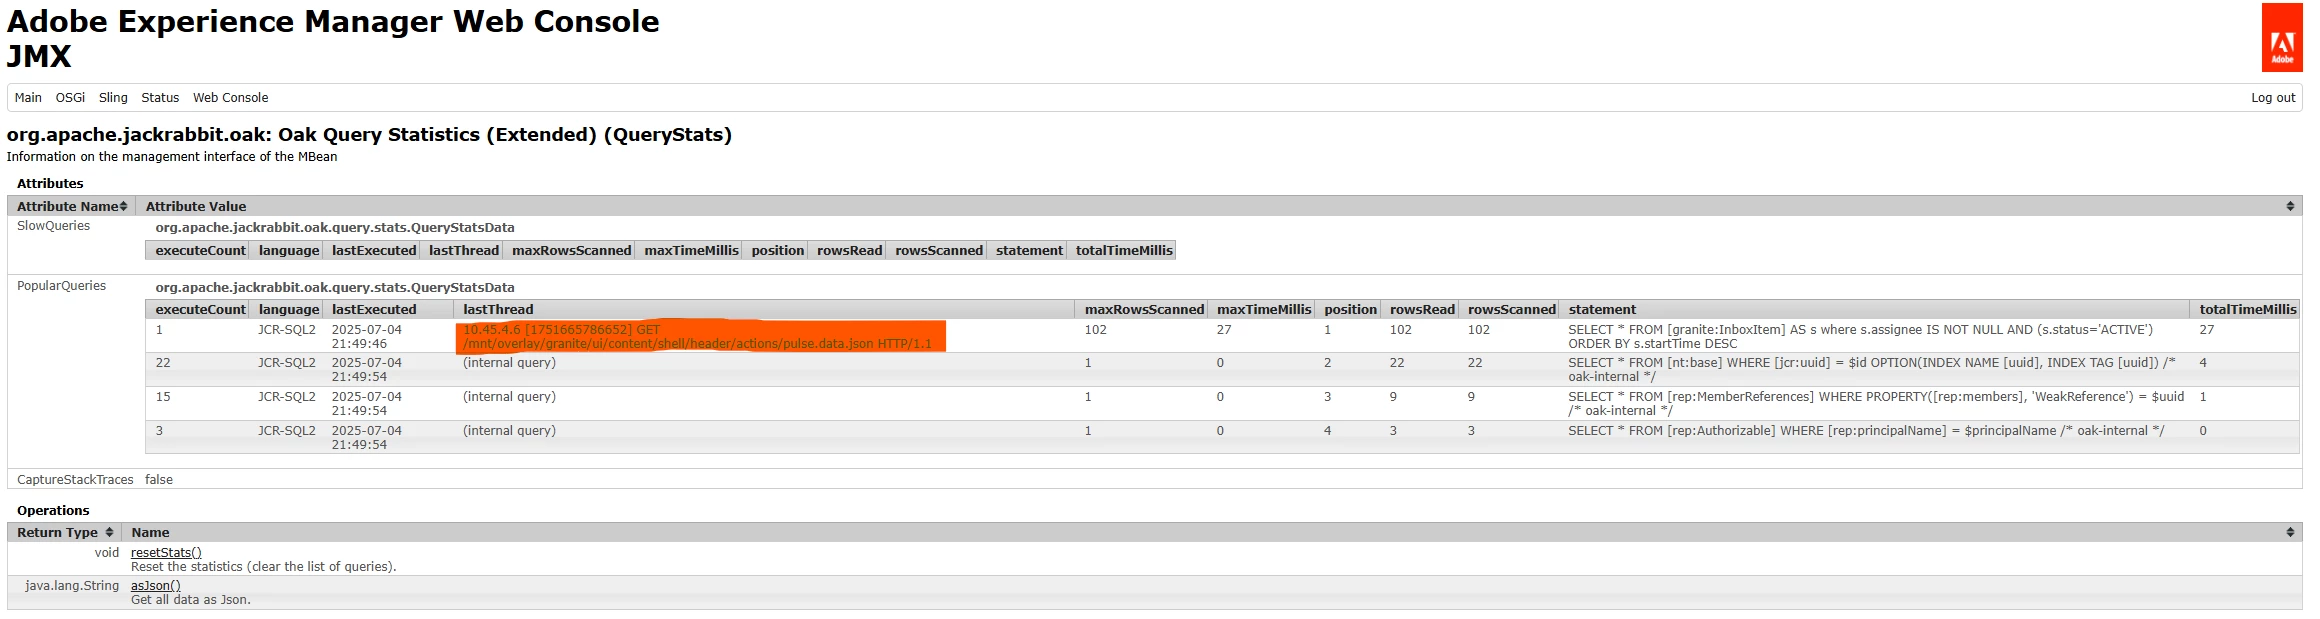
However, for some of the GraphQL queries I successfully execute, I’m unable to find any corresponding JCR-SQL2 entries in the QueryStats. Instead, I consistently see a single query (red-marked on the ss) that appears unrelated to the specific query being executed:

JelenaS123_0-1751667485921.png

Can anyone help me understand why the actual JCR queries might not be showing up?

Is it possible that certain GraphQL queries are resolved without triggering JCR-SQL2 under the hood?

Any insights or guidance would be greatly appreciated — thank you in advance!


1 Accepted Solution

Avatar

Correct answer by
Community Advisor

Hi @JelenaS123,

Since not all GraphQL queries in AEM rely on JCR-SQL2, you can analyze performance by:

  1. Disabling GraphQL caching temporarily via /system/console/configMgr/com.adobe.cq.graphql.persistentcache.impl.GraphqlCacheImpl to measure true response times.

  2. Using tools like Postman, GraphQL Playground, or curl with timing enabled to compare response times before and after changes.

  3. Enabling DEBUG logs for:

    • com.adobe.cq.graphql

    • com.adobe.cq.dam.cfm.impl.graphql

    This helps detect backend resolution times.

  4. Checking AEM system metrics (/status-heap, /status-slingthreads) for resource impact during query execution.

These steps should give you a good sense of whether optimizations are effective.


Santosh Sai

AEM BlogsLinkedIn


View solution in original post

5 Replies

Avatar

Community Advisor

Hi @JelenaS123,

I think, some GraphQL queries do not result in JCR-SQL2 executions, especially if the data is retrieved via direct resource access, in-memory resolution, or cached lookups rather than through the JCR query engine.

  • GraphQL resolvers (especially for Content Fragments) can resolve nodes using direct path-based access (ResourceResolver#getResource) without executing a query. These do not show up in the JCR QueryStats.
  • If you're seeing only a single red-marked query consistently, it might be part of the GraphQL schema introspection or fragment metadata resolution (eg. a one-time query fetching model definitions).
    It's not necessarily tied to your specific content data query.

You can try these steps to verify whether JCR-SQL2 is used:

  • Temporarily disable caching (/system/console/configMgr/com.adobe.cq.graphql.persistentcache.impl.GraphqlCacheImpl)

  • Force a query-like condition, eg. a GraphQL query with a dynamic filter:

    {
      contentFragmentList(filter: {title: {_expressions: [{value: "Test", _operator: CONTAINS}]}}) {
        items {
          title
          _path
        }
      }
    }


    These typically trigger JCR-SQL2 queries.

  • Enable DEBUG logging for:

    com.adobe.cq.graphql
    com.adobe.cq.dam.cfm.impl.graphql
    org.apache.jackrabbit.oak.query
  • Use Query Performance Analyzer to monitor runtime queries during GraphQL execution.


Santosh Sai

AEM BlogsLinkedIn


Avatar

Level 2

@SantoshSai That makes sense, thank you for the explanation.

Since the methodology I previously used to test GraphQL endpoints relying on SQL2 isn’t applicable here, do you have any recommendations on how to analyze their performance?

I’m trying to determine whether optimization is needed, and if so, after applying changes, how to measure whether query performance has actually improved.

Avatar

Correct answer by
Community Advisor

Hi @JelenaS123,

Since not all GraphQL queries in AEM rely on JCR-SQL2, you can analyze performance by:

  1. Disabling GraphQL caching temporarily via /system/console/configMgr/com.adobe.cq.graphql.persistentcache.impl.GraphqlCacheImpl to measure true response times.

  2. Using tools like Postman, GraphQL Playground, or curl with timing enabled to compare response times before and after changes.

  3. Enabling DEBUG logs for:

    • com.adobe.cq.graphql

    • com.adobe.cq.dam.cfm.impl.graphql

    This helps detect backend resolution times.

  4. Checking AEM system metrics (/status-heap, /status-slingthreads) for resource impact during query execution.

These steps should give you a good sense of whether optimizations are effective.


Santosh Sai

AEM BlogsLinkedIn


Avatar

Level 6

@JelenaS123 If you talk about optimization , first thing you need to ensure is you should path based persistent queries instead of list based. You need to supply the fragment to the query via params then you will see very quick results but when you use List based queries then this will be the problem. Always use path based queries.

Avatar

Administrator

@JelenaS123 Hi there, wanted to follow up! Did you manage to resolve your question? If so, it would be great if you could share how you solved it, as that knowledge could guide others with similar challenges. Also, if one of the replies helped, even if it didn’t completely solve the issue but gave you the right direction, marking it as accepted will make it easier for others to discover. Your update ensures the conversation stays valuable for the whole community.


Kautuk Sahni