Memory leak Analysis: Heap dump pointing to internal framework classes
Hello There,
There is a problem in the application where the heap is becoming full slowly overtime and leading to outofmemory exception.
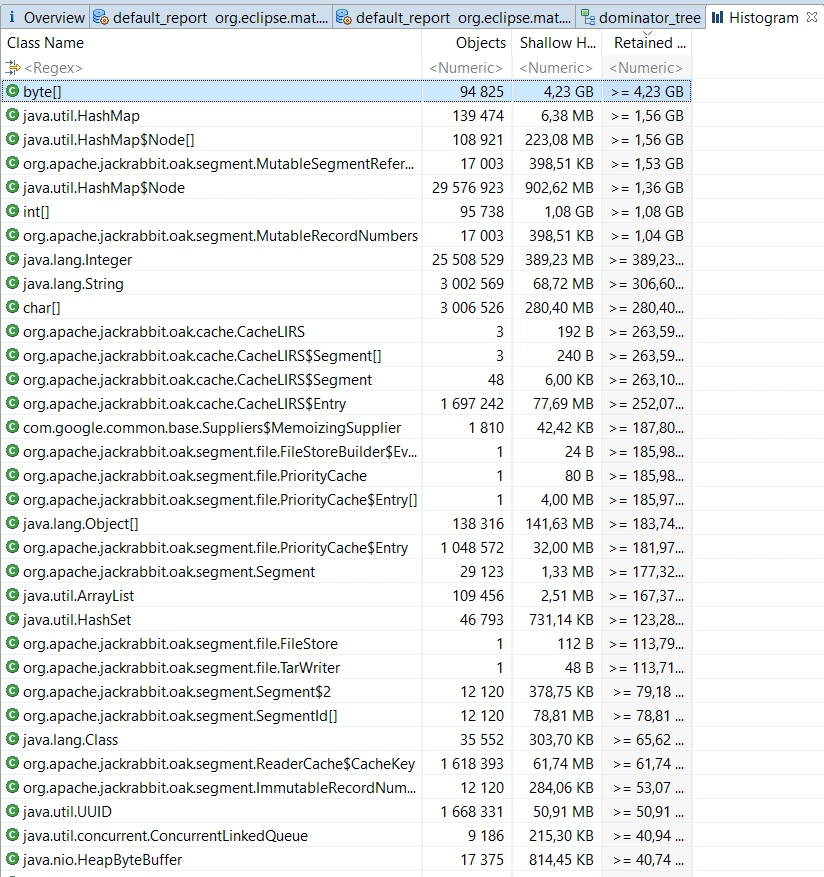
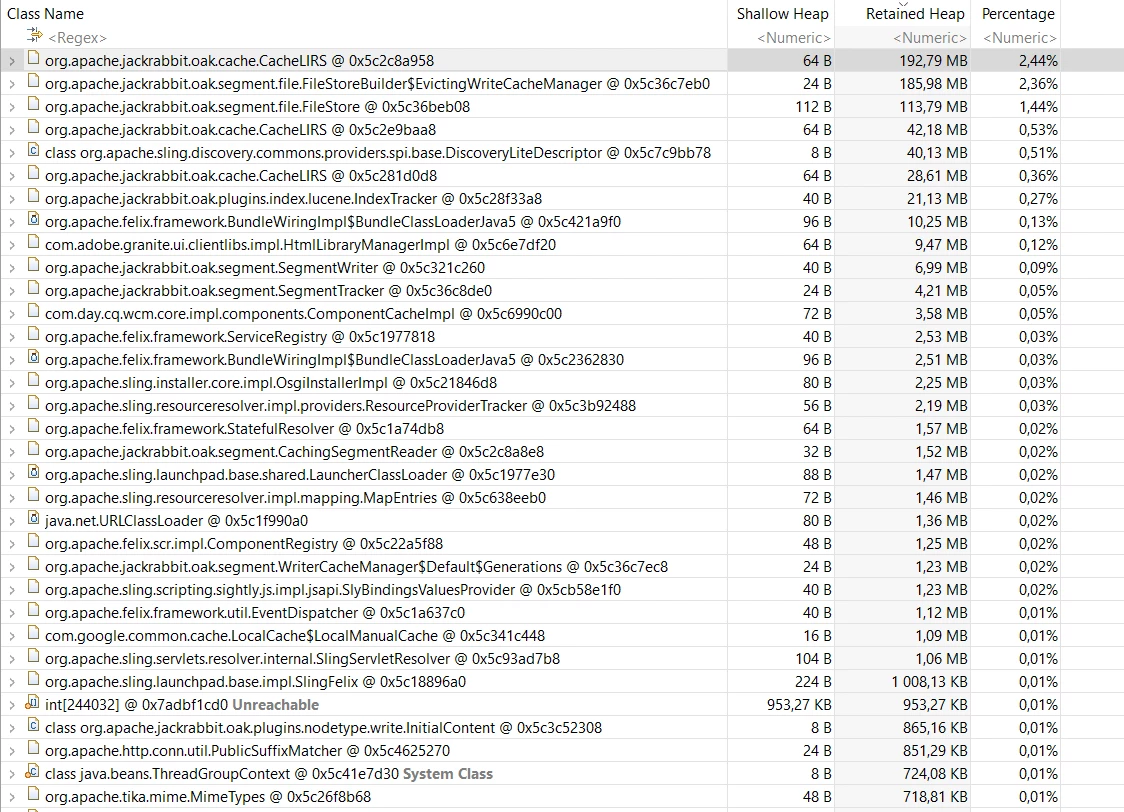
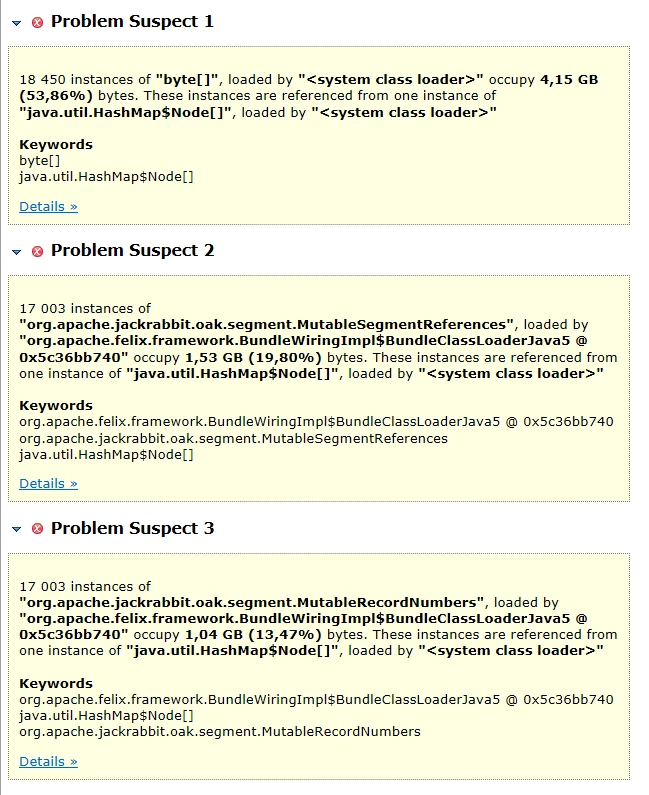
From the heap dump analysis I only see the internal class from OAK Tar.
Please see the below screenshots
Histogram(by retained size)

Dominator tree

Problem Suspects reported by eclipse MAT

Could someone direct me as to where the problem could be ?