Expand my Community achievements bar.

Guidelines for the Responsible Use of Generative AI in the Experience Cloud Community.
SOLVED

How to/where to check error logs when we hit https://ims-na1.adobelogin.com/ims/exchange/jwt endpoint

Avatar

Level 2

Hi All,

Can anyone help me in understanding on how to/where to check error logs (at AEM side) when we make POST request to https://ims-na1.adobelogin.com/ims/exchange/jwt

We are trying to integrate Pega with AEM. Above endpoint works prefect via POSTMAN. However, when we are hitting via Pega, we are receiving 400 bad request error. I could see that request body JSON (containing exp, iss, sub, aud etc.) looks perfect (same as POSTMAN). Please help!

Thanks,

Lavanya
1 Accepted Solution

Avatar

Correct answer by
Community Advisor

@lmalyala There are two ways to see the log files in AEM.


1.Go to the felix console ->Sling->Log Support, and search for your log file. You can directly open the log file from here.

AvinashGupta01_0-1669653709544.png


2. The logs files also gets created under crx-quickstart/logs. You can open your log files and see the logs.


In case your are using AEM as cloud service, refer to the documentation here.  the https://experienceleague.adobe.com/docs/experience-manager-cloud-service/content/implementing/using-... 

View solution in original post

2 Replies

Avatar

Correct answer by
Community Advisor

@lmalyala There are two ways to see the log files in AEM.


1.Go to the felix console ->Sling->Log Support, and search for your log file. You can directly open the log file from here.

AvinashGupta01_0-1669653709544.png


2. The logs files also gets created under crx-quickstart/logs. You can open your log files and see the logs.


In case your are using AEM as cloud service, refer to the documentation here.  the https://experienceleague.adobe.com/docs/experience-manager-cloud-service/content/implementing/using-... 

Avatar

Community Advisor

Hi @lmalyala,

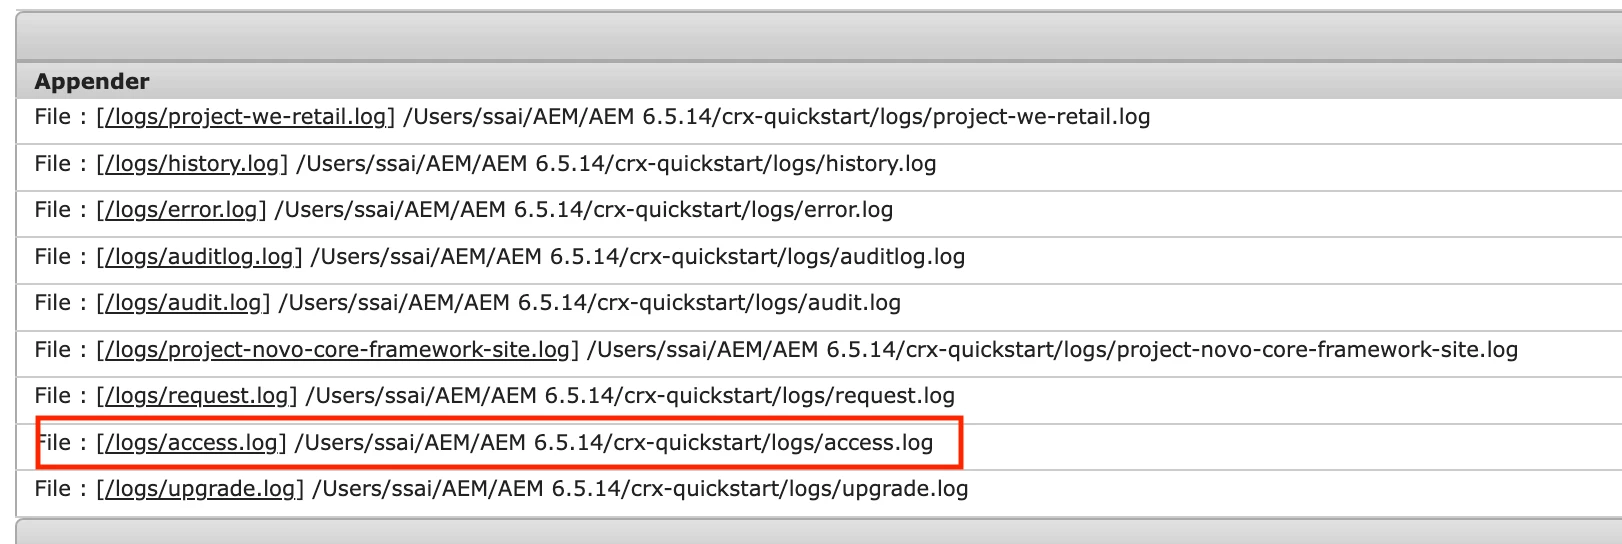
You must check that in access.log here: http://localhost:4502/system/console/slinglog 

Screen Shot 2022-11-28 at 12.12.26 PM.png

This log file is almost similar to request.log. It helps us to know the following things:

  • Who is accessing
  • Which resource is being accessed
  • At what time resource is being accessed

The requests in access.log is exactly half of request.log because the access.log defines all the request and response in just one line.

Each line in Access.log contains the following information:

  • Access IP - The IP of that system from where the request is coming.
  • Access User - The user who is sending the request.
  • Access Time - At what time resource is being accessed.
  • Request Method- The method of the request like GET, POST, PUT etc.
  • Access Resource - The resource which is accessed by user.
  • Protocol like HTTP/1.1 or HTTPS
  • Response Status Code like - 404, 200, 401 etc.
  • Content Length - It determines the length of response content.
  • Referrer URL - The referrer is the web page that sends visitors to your site using a link. In other words, it’s the web page that a person was on right before they landed on your page.
  • User Agent-  It refers to a web browser telling a website information about the browser and operating system.
    accesslog.jpeg

Hope that helps!

Regards,

Santosh