Developer Console and Adobe I/O CLI for Cloud Manager to Debug AEM as a Cloud Service (AEMaaCS) | AEM Community Blog Seeding

Developer Console and Adobe I/O CLI for Cloud Manager to Debug AEM as a Cloud Service (AEMaaCS) by Albin Issac
Abstract
AEM as a Cloud Service provides a Developer Console for each environment that exposes various details of the running AEM service that are helpful in debugging. Each AEM as a Cloud Service environment has its own Developer Console.

Adobe I/O CLI for Cloud Manager provides commands to download/tail the logs from AEM as a Cloud Service environment.
Some of the below Adobe documents provides the required details on this topic, thought of sharing my learning for reference
Debugging AEM as a Cloud Service | Adobe Experience Manager

The Developer console can be accessed through Cloud Manager or Adobe I/O CLI for Cloud Manager
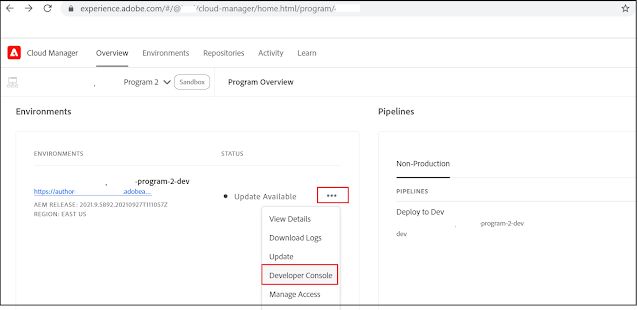
Log in to CM, select the appropriate Program(Select the Program enabled for AEM as a Cloud — the AMS customers participating in AEM as a Cloud will have two different programs)

Click on the three dots for the specific environment, and select “Developer Console”, the same can be accessed through the Environment tab. You will be able to see the Developer Console with the environment details.
AEM as a Cloud Service

Change the value in the pod dropdown list to view the different server details on the environment.
To access and use the Developer Consol, the developer must be a member of the Cloud Manager Product’s Developer — Cloud Service Product Profile. Also, the developer must be a member of the AEM Users or AEM Administrators Product Profile on AEM Author and/or Publish. The exception being for Sandbox Programs, where any user with access to the Cloud Manager Sandbox Program will have access to Developer Console.
The Developer Console provides similar information as the AEM SDK’s local quickstart’s OSGi Web console, with the marked difference that the Developer Console is read-only.
Read Full Blog
Developer Console and Adobe I/O CLI for Cloud Manager to Debug AEM as a Cloud Service (AEMaaCS)
Q&A
Please use this thread to ask the related questions.


