Expand my Community achievements bar.

SOLVED

AEMaaCS - Dispatcher - Different response time for /favicon.ico Requests

Avatar

Community Advisor

Hi AEM Community,


My AEMaaCS dispatcher is frequently hit with requests "GET /favicon.ico HTTP/1.1"

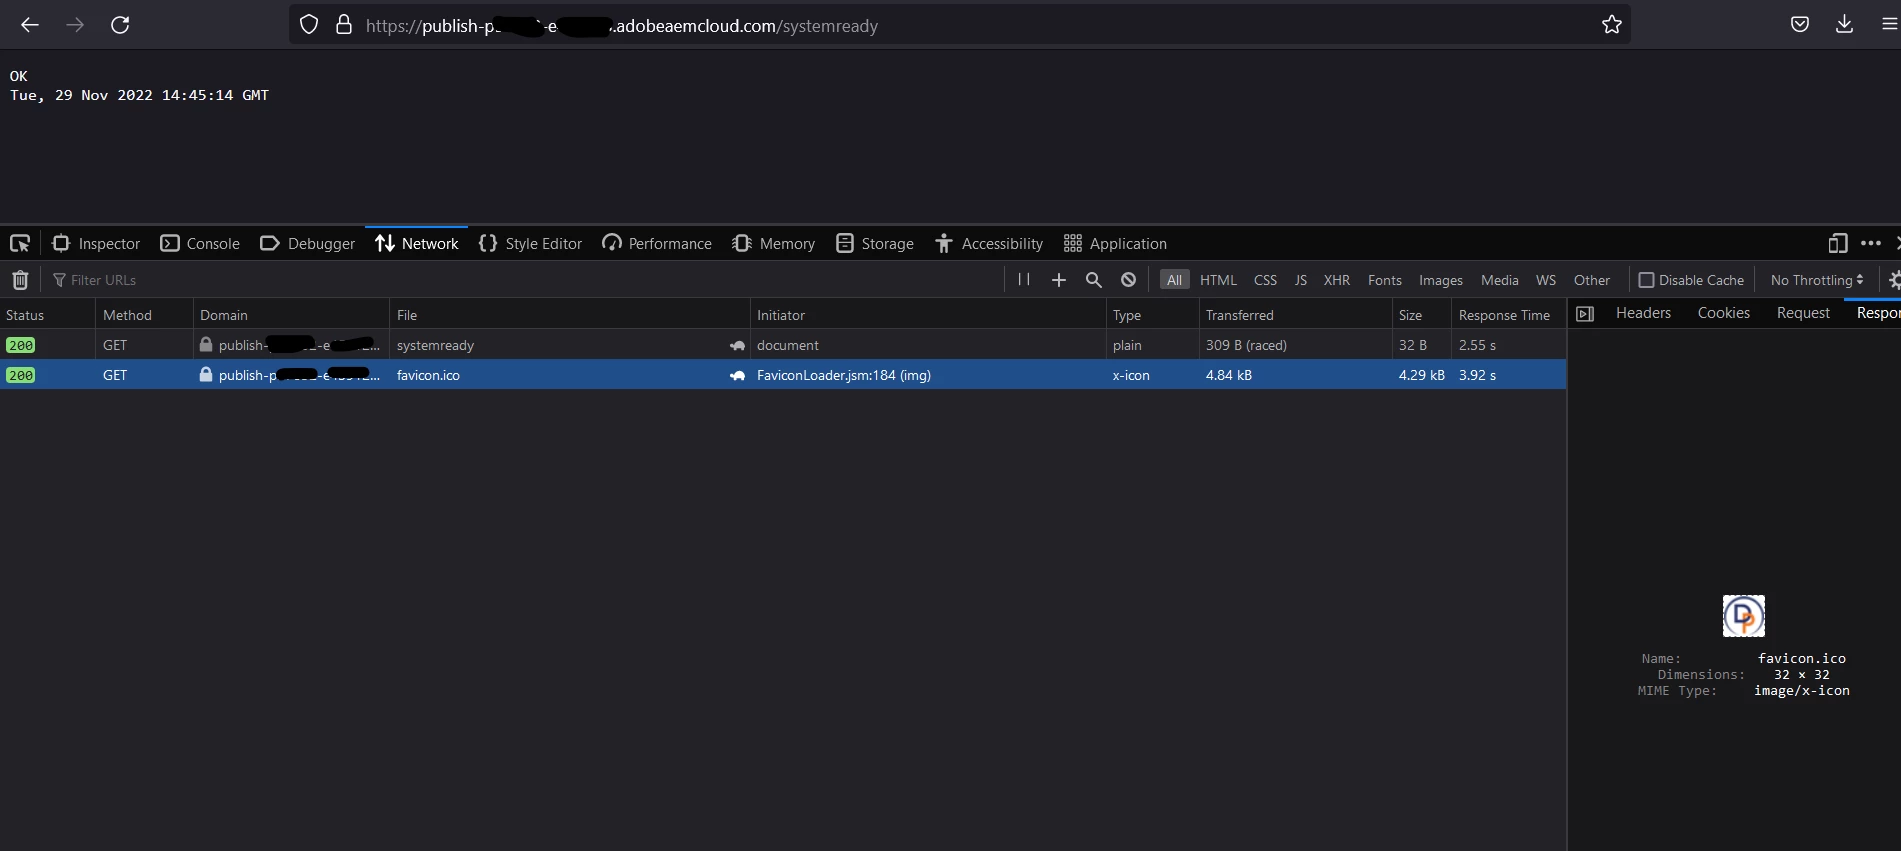
The requests origin from Publish's /systemready API call triggered by /systemready -  https://publish-pyyzzz-ezzzabc.adobeaemcloud.com/systemready


As seen in screenshot below - any call to above URL leads to /favicon.ico being also triggered.
The /favicon.ico call is currently triggered at a rate of 5 requests per minute as per the dispatcher logs.

Rohan_Garg_0-1669733173233.png


Query 1 - Is there any way to decouple the connection between the /systemready and /favicon.ico call ? The /favicon.ico call seems rather too frequent.


Moving on, previously since this request was not handled it gave a 404 status and took more than 30s processing time as per dispatcher logs. To handle that we introduced a redirect to let this request redirect to a DAM asset in our repo.

This changed the HTTP Status code to 302 followed by 200 and brought down the processing time to 3s for most requests.


However, as seen in the below logs not all requests are being served in 3s. Some requests (1:5 ratio) are still taking 30s or more to process.

[29/Nov/2022:06:36:47] "GET /content/dam/brandA/favicon.ico" 3028ms [publishfarm/0] [actionnone] publish-p123-eabc
[29/Nov/2022:06:37:00] "GET /content/dam/brandA/favicon.ico" 30214ms [publishfarm/0] [actionnone] publish-p123-eabc
[29/Nov/2022:06:37:01] "GET /content/dam/brandA/favicon.ico" 3028ms [publishfarm/0] [actionnone] publish-p123-eabc
[29/Nov/2022:06:37:15] "GET /content/dam/brandA/favicon.ico" 30217ms [publishfarm/0] [actionnone] publish-p123-eabc
[29/Nov/2022:06:37:18] "GET /content/dam/brandA/favicon.ico" 3028ms [publishfarm/0] [actionnone] publish-p123-eabc
[29/Nov/2022:06:37:27] "GET /content/dam/brandA/favicon.ico" 30213ms [publishfarm/0] [actionnone] publish-p123-eabc
[29/Nov/2022:06:37:40] "GET /content/dam/brandA/favicon.ico" 30211ms [publishfarm/0] [actionnone] publish-p123-eabc
[29/Nov/2022:06:37:52] "GET /content/dam/brandA/favicon.ico" 30212ms [publishfarm/0] [actionnone] publish-p123-eabc


Query 2 - Why do some requests take 3s while others take 30s to process as per aemdispatcher logs ?

@arunpatidar@Mohit_KBansal@B_Sravan, @Jörg_Hoh, @kautuk_sahni 


Thanks,

Rohan Garg

Topics

Topics help categorize Community content and increase your ability to discover relevant content.

2 Accepted Solutions

Avatar

Correct answer by
Community Advisor

Can you check if the hit is from dispatcher or from Publishers for /content/dam/brandA/us/en/general/favicon.ico?

you can enable the DEBUG logs in local and check the same, if ico file is getting cached or not?

If it is getting cached then you should not have concern with publish response time because it is going to be request one and cached after the cache reset.


Arun Patidar

View solution in original post

Avatar

Correct answer by
Community Advisor

@arunpatidar  - Thanks for your response. I validated on local and the resource file was indeed getting cached but for some reason the request processing time being displayed in logs for STAGE is unacceptably high.


However, we went live with our website yesterday and the production logs show the favicon being cached properly and the requests taking avg time of 5-10 ms to serve and at max when cache is being created it takes 770ms which is still great!


Also, another interesting observation I noticed on STAGE is when we hit the direct request from publish or even dispatcher, the icon takes 1-2 seconds to load but the request processing time is still shown as +30m.

I think the stat for request processing time might be inaccurate but like you said since the cache is happening it need not be a concern from performance point of view!


Thanks a lot for your input again! Its highly appreciated!


Thanks,

Rohan Garg

View solution in original post

4 Replies

Avatar

Community Advisor

response time varies for same request and depends on load on the publish instance on that particular time.


Arun Patidar

Avatar

Community Advisor

@arunpatidar - Thanks for the input, I had one query which I hope won't be much of a bother

As per the dispatcher logs, here is how the flow seems to be working -


1.Publish Instance's *..adobeaemcloud.com/systemready call triggers the /favicon.ico call
HTTPD Access Log -

cm-pzzzyyy-eabc123-aem-publish-76b69d5bf-tkhf6 - - 02/Dec/2022:06:06:21 +0000 "GET /favicon.ico HTTP/1.1" 302 - "https://publish-pzzzyyy-eabc123.adobeaemcloud.com/systemready" "Mozilla/5.0 (X11; Linux x86_64) AppleWebKit/537.36 (KHTML, like Gecko) Chrome/100.0.4896.60 Safari/537.36"


2. The dispatcher has a rule which explicitly handles the redirection to a DAM asset

#Rewrite Rule for Favicon
RewriteCond %{REQUEST_URI} ^/favicon.ico$
RewriteRule ^/favicon.ico /content/dam/brandA/us/en/general/favicon.ico [NC,PT,L]

[02/Dec/2022:06:06:22\1 +0000] [I] [cm-pzzzyyy-eabc123-aem-publish-cccdd7c7d-7m9hz] "GET /content/dam/brandA/us/en/general/favicon.ico" 30210ms [publishfarm/0] [actionnone] publish-pzzzyyy-eabc123.adobeaemcloud.com

Even though we are caching everything in the cache rules as per the default_rules.any -

# Default allow all items to cache
/0000 {
/glob "*"
/type "allow"
}


I added another cache rule below -

/0002 {
/glob "/content/dam/brandA/us/en/general/favicon.ico"
/type "allow"
}

After adding this cache rule, the previous ratio of slow requests to fast processing one reversed and more requests are now taking longer time to process.


Any suggestions on how I can effectively cache this request "/favicon.ico" and its response "/content/dam/brandA/us/en/general/favicon.ico" ?


Thanks,

Rohan Garg

Avatar

Correct answer by
Community Advisor

Can you check if the hit is from dispatcher or from Publishers for /content/dam/brandA/us/en/general/favicon.ico?

you can enable the DEBUG logs in local and check the same, if ico file is getting cached or not?

If it is getting cached then you should not have concern with publish response time because it is going to be request one and cached after the cache reset.


Arun Patidar

Avatar

Correct answer by
Community Advisor

@arunpatidar  - Thanks for your response. I validated on local and the resource file was indeed getting cached but for some reason the request processing time being displayed in logs for STAGE is unacceptably high.


However, we went live with our website yesterday and the production logs show the favicon being cached properly and the requests taking avg time of 5-10 ms to serve and at max when cache is being created it takes 770ms which is still great!


Also, another interesting observation I noticed on STAGE is when we hit the direct request from publish or even dispatcher, the icon takes 1-2 seconds to load but the request processing time is still shown as +30m.

I think the stat for request processing time might be inaccurate but like you said since the cache is happening it need not be a concern from performance point of view!


Thanks a lot for your input again! Its highly appreciated!


Thanks,

Rohan Garg