Expand my Community achievements bar.

Dive into Adobe Summit 2024! Explore curated list of AEM sessions & labs, register, connect with experts, ask questions, engage, and share insights. Don't miss the excitement.
SOLVED

Javascript Console window not available in HTML5 preview.

Avatar

Level 8

We have a lot of XFA forms with complex Javascript code. We used to use the Javascript Console Window (Ctrl-J) to debug the code. Now, under HTML5, I am unable to view the console window, and I cannot debug the code and find out what are the errors and exceptions.

Appreciate your feedback to let us know how to view the console window (Ctrl-J) under HTML5 preview mode, and if this is not possible, then how to troubleshoot Javascript code?

Tarek

1 Accepted Solution

Avatar

Correct answer by
Level 2

Hi Tarek, 

During the development phase you can try using the debugger statement before the code snippet you want to debug. For reference: http://www.w3schools.com/jsref/jsref_debugger.asp

View solution in original post

7 Replies

Avatar

Level 8

You can use the browser developer console by pressing F12.  You can set breakpoints and debug directly in the browser.

Avatar

Level 8

Ok, I see. But, how I can debug the code using LiveCycle Designer HTML5 preview tab. If I have to use the browser, then I must publish the completed work every time I make modifications. This will be very time consuming and annoying.

Tarek

Avatar

Level 8

TundraSteve wrote...

You can use the browser developer console by pressing F12.  You can set breakpoints and debug directly in the browser.


I tried to use F12 to debug the javascript code I write, but I didn't find it using the developer tools. It seems it is hidden somewhere difficult to reach.

I appreciate it if you can give more details how to do that.

Tarek

Avatar

Correct answer by
Level 2

Hi Tarek, 

During the development phase you can try using the debugger statement before the code snippet you want to debug. For reference: http://www.w3schools.com/jsref/jsref_debugger.asp

Avatar

Level 8

sudhanshu.singh wrote...

Hi Tarek, 

During the development phase you can try using the debugger statement before the code snippet you want to debug. For reference: http://www.w3schools.com/jsref/jsref_debugger.asp


Yes ...! Thank you cool ... see below snapshot... it worked.


One more question please ....

This means that I have to check-out the file, changes the code as needed, then check-in the file so that the new changes are available on the server. Correct?

Is there a way to do the testing without the need to perform the check-out/check-in operations?

Avatar

Level 2

If you are currently working in a development environment where the server can access a shared location where you can place the XDP files, then you can use the contentRoot parameter to achieve this.

Reference url: https://helpx.adobe.com/aem-forms/6-2/rendering-form-template.html

Avatar

Level 8

Hi sudhanshu.singh,

Appreciate your help again...

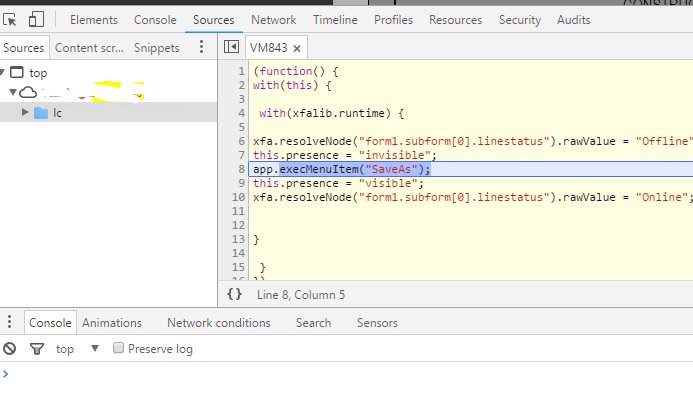
I noticed that when there is exception while executing unsupported Javascript (as per snapshot below), the execution just stops without any error reported.

Also, I am unable to edit the code during runtime (with the yellow background). Usually, I am able to edit the code on the fly without any problem.

Appreciate your feedback.