The event is firing in the debugger but the data is not showing up in the Analytics dashboard
- Mark as New
- Follow
- Mute
- Subscribe to RSS Feed
- Permalink
- Report
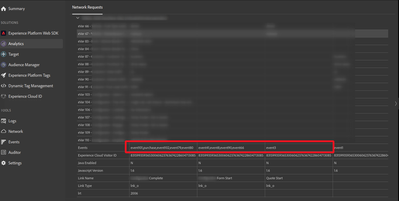
I can see the following events firing in the Adobe Analytics debugger
However, these fired events are not showing up on the Adobe Analytics dashboard
I am firing three rules at a single user action (button click) to fire these events. However, these are three different unique event actions in the digitaldataobject.
At the moment, it looks like rules for [event 3] and [event41,8,90,61] are showing up correctly in the analytics dashboard. However, the rule for [events 101,102,79,80,purchase] are heavily underreporting
Is there any reason for this discrepancy?
Views
Replies
Total Likes

- Mark as New
- Follow
- Mute
- Subscribe to RSS Feed
- Permalink
- Report
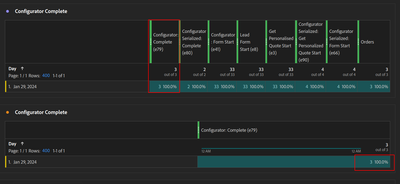
Looking at your second screenshot, what are in rows 1-5 of the time parting evar?
It looks like the events are being counted, just not attributed to those values of the evar. But we can only see rows 6 and 7, is it possible it could attributed for one of the values in rows 1-5?

- Mark as New
- Follow
- Mute
- Subscribe to RSS Feed
- Permalink
- Report
Agreed, we can see there are event counts in the totals row, and there's "2" in total... but 7 rows of breakdown data... but those breakdowns will be shown based on other columns of event data.... (examples e41, e8, e3, e90, e66).
The first screen shot (showing the capturing of data), doesn't show us the v7 value (this is off the visible page of collected data), to confirm those values correspond to the event data.
Also note, that if you collected the data then immediately checked your report, there is about an hour or so processing delay. Data won't appear directly in Workspaces.
- Mark as New
- Follow
- Mute
- Subscribe to RSS Feed
- Permalink
- Report
Hi @MandyGeorge @Jennifer_Dungan,
We have removed the time parting eVar (v7) from the report but we can still see the underlying issue.
The issue is that events 79 and 80 (Rule 1) do not have many hits but events in Rules 2 and 3 have a large amount of hits.
We are firing all of these events at the same user action and this is the only place in the site that these events are firing. I can see that they are being fired in the digitaldata layer as well when I complete the action.
Events 79 and 80 are larger than the other ones (more eVars and props are passed). Can this be a concern?
Also, can the events order (under advance options) or time out can be an issue? I have set the order as 50 for all three events and time out as 2000 (milliseconds) for all set variable actions.
We checked the analytics dashboard a few hours after the click. Also, the above screenshot is from 5 to 7 hours after the last testing round.
Any advice is greatly appreciated
Thanks in advance!
Views
Replies
Total Likes

- Mark as New
- Follow
- Mute
- Subscribe to RSS Feed
- Permalink
- Report
The size of the calls (number of events and eVars) shouldn't be a concern... Adobe will send values as GET when the total length of the data is under 2000 characters, and as POST when the total length is over 2000 characters... most of our calls fall into the POST method... I only had an issue about 10 years ago (where the POST wasn't recording properly), but I haven't seen that issue since.. and I am sure there would be a lot of complaints if that was back.
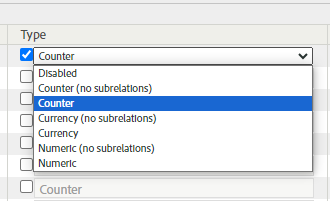
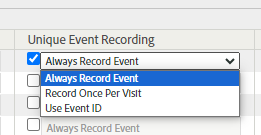
Can you confirm that you events 79 and 80 are configured as counter events? As well, can you confirm that they are both set to the correct recording events? I just want to rule out that the issue is caused by a mis-configuration:
Now, I think you might have a uniqueness setting on eVar80 (since it's labeled as "serialized")... you are passing a completely unique value there correct? Once a serial has been used, it's for life... that same serialization will never count again... And from your debugging, I don't see a serial being passed... so that might be part of the problem there....
- Mark as New
- Follow
- Mute
- Subscribe to RSS Feed
- Permalink
- Report
Hi @Jennifer_Dungan,
Yes, we have configured them as Counter events. They have been configured as "Always Record Event" for Event 79 and "Record Once Per Visit" for Event 80 which is the serialized event
On this occasion, even tho it says serialised we are not using unique identifiers to serialise the event. We have only set admin configurations to record one hit per visit.
At this moment in time, we are mainly concerned about event 79 having a very low count.

- Mark as New
- Follow
- Mute
- Subscribe to RSS Feed
- Permalink
- Report
Ok, that's good. I just wanted to confirm that the configuration... it's hard not being able to see the full picture, so I was just starting with the basics.
Next, have you tried logging into the Platform Debugger, and turning on "Show post processed hits" (assuming its not broken again).
This should give you immediate feedback about what Adobe is recording after processing... it's possible that there is an old VISTA rule or Processing Rules that could be removing the events?
Views
Replies
Total Likes
Views
Likes
Replies


