Expand my Community achievements bar.

Webinar: Adobe Customer Journey Analytics Product Innovations: A Quarterly Overview. Come learn for the Adobe Analytics Product team who will be covering AJO reporting, Graph-based Stitching, guided analysis for CJA, and more!
SOLVED

Site Path Analysis from the Hompeage

Avatar

Level 1

Hi All,

  I'm new to adobe analytics, so please bare with me. I was asked to conduct a site path analysis starting from the homepage, which is the landing page on our website. On this home page, there's a call-to-action button which is the "shop now" button. Based on my research, I've realized that i have to use a flow visualization to examine how users flow from our homepage into other pages on our website. I built 2 flow Viz but it didn't answer the question, I will attach my latest Viz. My question is, How do i go about building this, assuming i want my flow to capture all the visits that arrived for the month at the official homepage and how they navigate from there.

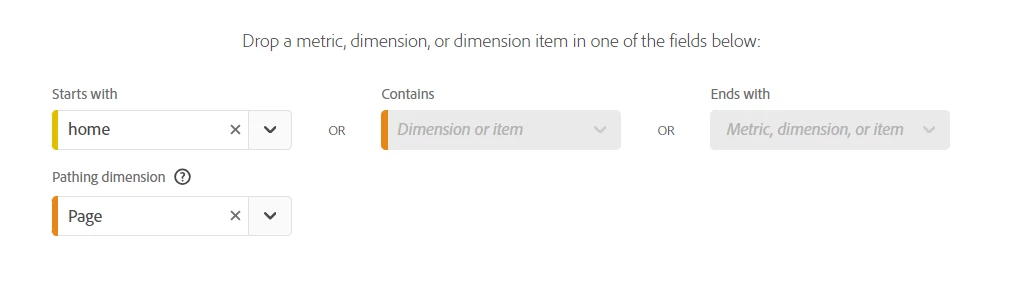
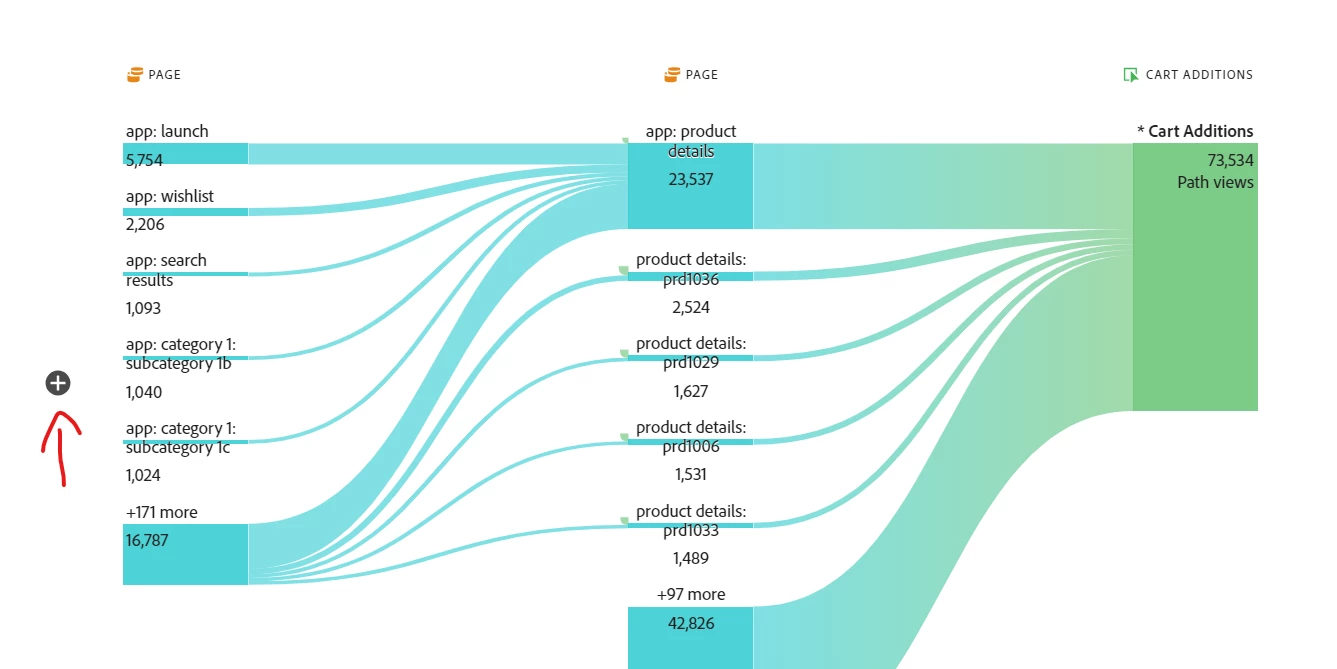
-First screenshot shows the flow that i built which didn't answer the question.

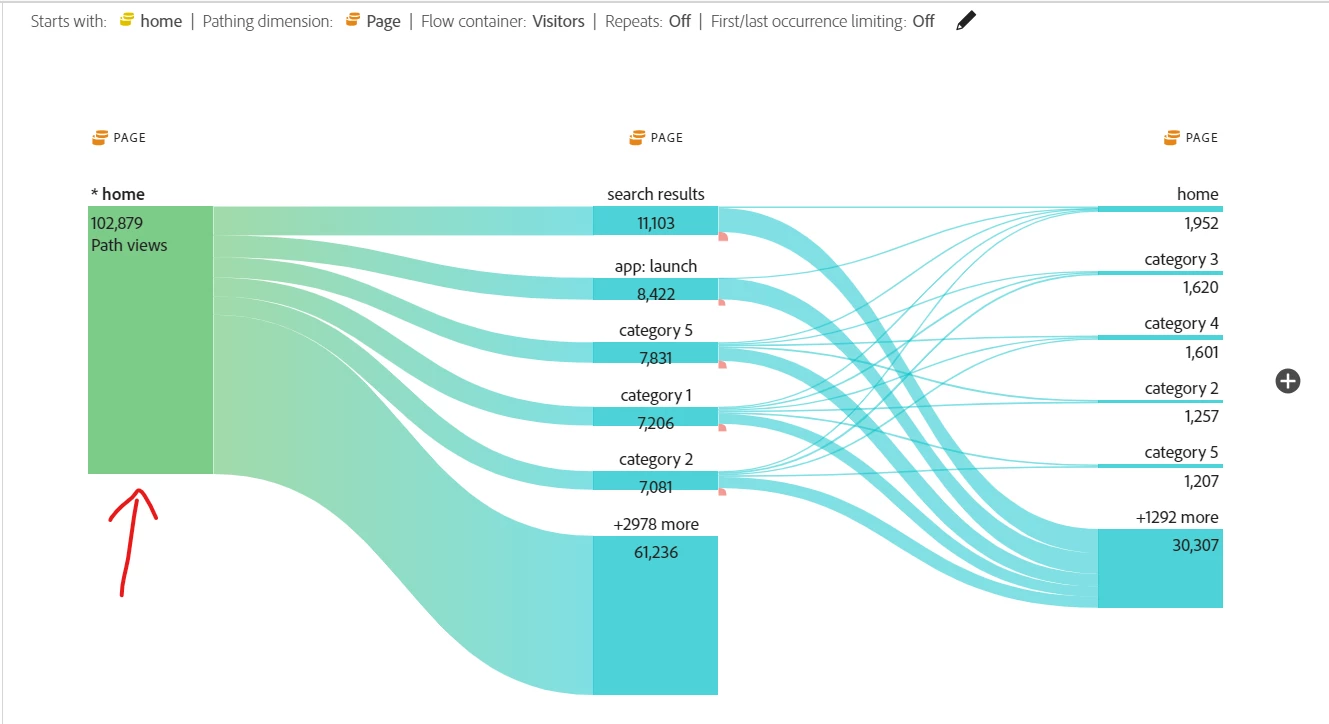
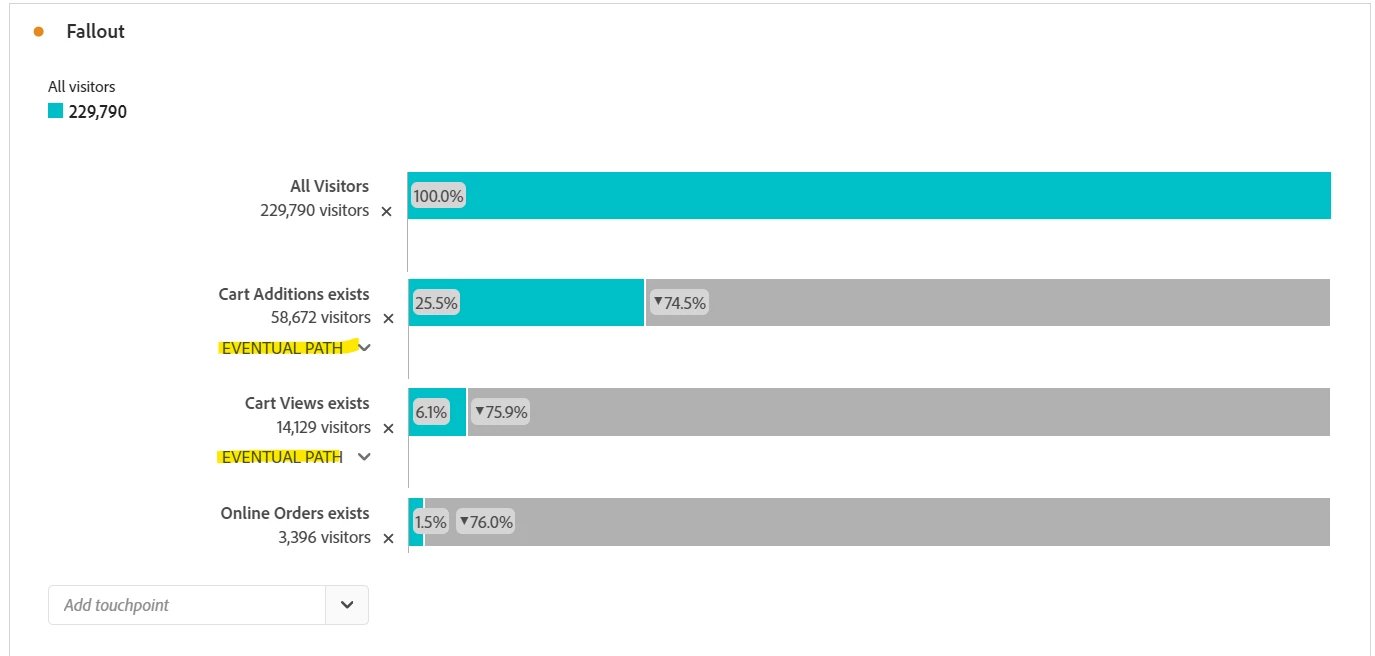
- Based on the second screenshot, out of 442k visits to the website 187k landed on the homepage, i want to see how users navigate from that homepage into the buyflow.

@Jennifer_Dungan 

@leocwlau 

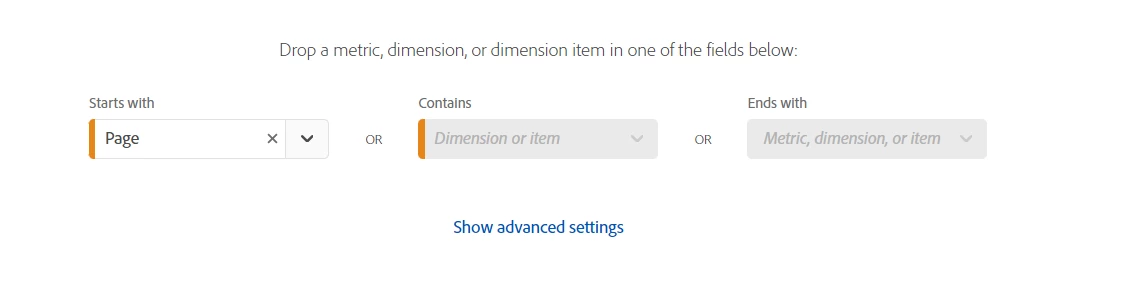
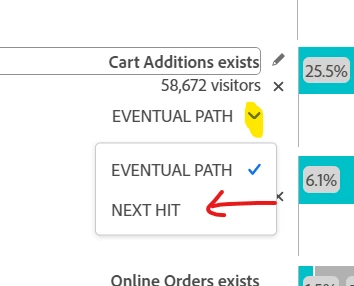
-Third screenshot, i tried to build the flow starting from the homepage specifically, but instead of the number showing 187k, it's only showing 88k. 


Thanks in advance

Topics

Topics help categorize Community content and increase your ability to discover relevant content.

1 Accepted Solution

Avatar

Correct answer by
Community Advisor

Hi @QuadriAl welcome to Adobe Analytics!


First off, I will be honest.. I find the flow diagram to be clunky.. while it does show flows through the website, I find it works better for more focused flows, at general levels like page types...


The problem is that some users are going to look at say 2 pages, and others might look at 20 pages... and having 20 columns in the diagram is too much... and what about 200 pages in the visit? You can't really anticipate for the variances.


Now, it looks like in your first example, you have the entry page set to basically "(v48) Compete Page URL exists" instead of specifying a specific value to start with:


 Use something like this:

Jennifer_Dungan_0-1707934755221.png


Instead of:

Jennifer_Dungan_1-1707934765268.png


To get this:

Jennifer_Dungan_2-1707934807168.png


Note: I am using sandbox data and it doesn't seem to have a URL, so I'm using the Page as a proxy.


And while you can add more columns to this flow, you probably won't catch everything... 


Or if you just want to see which page drove clicks on the "Shop Button", the flow diagram won't let you add events in the middle of the flow (to get the before/after flows). You could add the shop button event as the "end" of your flow (this doesn't mean the user exits the site, just that the flow should show the page leading up to this event).


I've used Cart Additions as a proxy here

Jennifer_Dungan_4-1707935698920.png


You can add more pages if you need to see farther back:

Jennifer_Dungan_5-1707935756376.png


Now, if you are trying to see a specific flow, as in Home Page > Shop Button > Shop > Purchase, etc, then you might be more interested in a Fallout Visualization, where you can specify the steps in the order you want to see the traffic either continuing down the path, or "falling off".


Jennifer_Dungan_6-1707935875394.png


Notice that there are "eventual path" meaning there can be pages and actions in-between. Or you can change them to "Next Hit"

Jennifer_Dungan_7-1707935935941.png


View solution in original post

4 Replies

Avatar

Correct answer by
Community Advisor

Hi @QuadriAl welcome to Adobe Analytics!


First off, I will be honest.. I find the flow diagram to be clunky.. while it does show flows through the website, I find it works better for more focused flows, at general levels like page types...


The problem is that some users are going to look at say 2 pages, and others might look at 20 pages... and having 20 columns in the diagram is too much... and what about 200 pages in the visit? You can't really anticipate for the variances.


Now, it looks like in your first example, you have the entry page set to basically "(v48) Compete Page URL exists" instead of specifying a specific value to start with:


 Use something like this:

Jennifer_Dungan_0-1707934755221.png


Instead of:

Jennifer_Dungan_1-1707934765268.png


To get this:

Jennifer_Dungan_2-1707934807168.png


Note: I am using sandbox data and it doesn't seem to have a URL, so I'm using the Page as a proxy.


And while you can add more columns to this flow, you probably won't catch everything... 


Or if you just want to see which page drove clicks on the "Shop Button", the flow diagram won't let you add events in the middle of the flow (to get the before/after flows). You could add the shop button event as the "end" of your flow (this doesn't mean the user exits the site, just that the flow should show the page leading up to this event).


I've used Cart Additions as a proxy here

Jennifer_Dungan_4-1707935698920.png


You can add more pages if you need to see farther back:

Jennifer_Dungan_5-1707935756376.png


Now, if you are trying to see a specific flow, as in Home Page > Shop Button > Shop > Purchase, etc, then you might be more interested in a Fallout Visualization, where you can specify the steps in the order you want to see the traffic either continuing down the path, or "falling off".


Jennifer_Dungan_6-1707935875394.png


Notice that there are "eventual path" meaning there can be pages and actions in-between. Or you can change them to "Next Hit"

Jennifer_Dungan_7-1707935935941.png


Avatar

Community Advisor

Hi @QuadriAl, welcome and I hope you are excited with the new journey into the world of Adobe Analytics.

One of my ex-colleagues called the flow visualization a spaghetti chart which is a very interesting and vivid description. The flow visualization is good for "exploring" the unknown so that we don't know what path visitors are going and try to find some interesting paths they are taking. The flow visualization can be messy and difficult to interpret, especially if you start mixing different dimensions, also the metric being used is "path view", you need to think about what that means.

But your case has a clear path to measure, so the fallout visualization as suggested by @Jennifer_Dungan could be a better choice.

Avatar

Community Advisor

Hahah "Spaghetti Chart" that's very accurate! Thanks for the laugh @leocwlau