I'm in the midst of identifying specific subsegments within broader segments exhibiting "most valuable" behavior. Would like to start by breaking out the general user audience via the following:
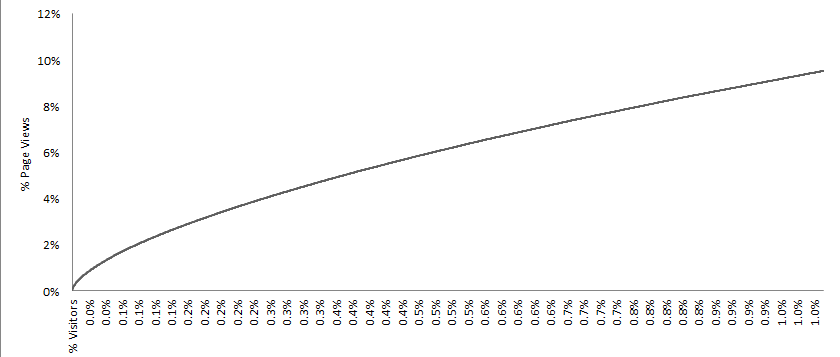
% of UVs on the X axis, % of PVs on the Y axis. Then I can apply segment filters to see differences between them.
Thoughts on how I can set this up within Site Catalyst / Ad Hoc?
Solved! Go to Solution.
Views
Replies
Total Likes
Hi John,
Run a data warehouse request with Visitor Id and Page Views. Then graph the data in Excel or whatever tool you choose like the chart shown below.
Best,
Ryan Praskievicz
Views
Replies
Total Likes
Hi John,
Run a data warehouse request with Visitor Id and Page Views. Then graph the data in Excel or whatever tool you choose like the chart shown below.
Best,
Ryan Praskievicz
Views
Replies
Total Likes