Expand my Community achievements bar.

Join us for the next Community Q&A Coffee Break on Tuesday April 23, 2024 with Eric Matisoff, Principal Evangelist, Analytics & Data Science, who will join us to discuss all the big news and announcements from Summit 2024!
SOLVED

Page Response time showing as a fixed high value (60second)

Avatar

Level 1

Hi,


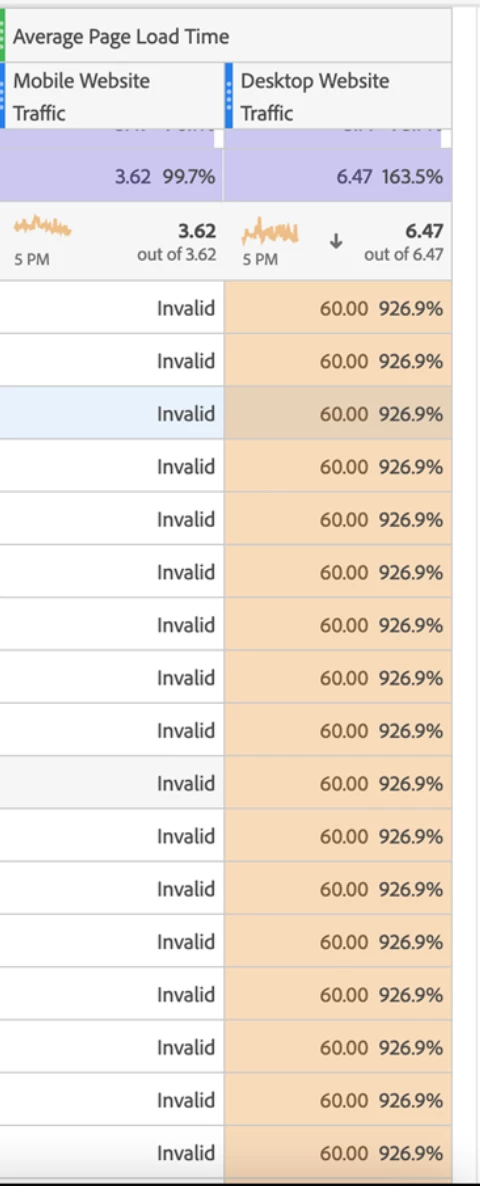
The product pages of the website is showing a constant 60 seconds as the page load time.  The origin server is responding to the request within a seconds. However on the AEM it shows up as 60 seconds intermittently for multiple pages.


Is there a way to dig deep and see the split up of page speed from AEM itself or is there any possibility to add additional logging.

Screenshot 2023-04-20 at 6.48.01 PM.png


Thanks

1 Accepted Solution

Avatar

Correct answer by
Community Advisor

Since "Average Page Load Time" isn't a standard metric, I am assuming you are using the plugin "getPageLoadTime"....


I don't use this myself, but I would first check that the plugin is returning expected results during testing... Have you confirmed that the data collected does look correct when you are viewing the product pages?


If the data looks like its tracking correct, I would then start with a more basic report... it's possible that the way the data is being segmented could be causing some unintended oddities? Start with the most basic table, confirm that values look realistic, then one by one, layer in segmentation and see if you can determine where things might be going wrong... double check how the segment(s) is/are created, maybe it (they) need(s) to be tweaked?

View solution in original post

1 Reply

Avatar

Correct answer by
Community Advisor

Since "Average Page Load Time" isn't a standard metric, I am assuming you are using the plugin "getPageLoadTime"....


I don't use this myself, but I would first check that the plugin is returning expected results during testing... Have you confirmed that the data collected does look correct when you are viewing the product pages?


If the data looks like its tracking correct, I would then start with a more basic report... it's possible that the way the data is being segmented could be causing some unintended oddities? Start with the most basic table, confirm that values look realistic, then one by one, layer in segmentation and see if you can determine where things might be going wrong... double check how the segment(s) is/are created, maybe it (they) need(s) to be tweaked?