Matching/reading numbers in a report | Community
Skip to main content
Vinay_Chauhan
Community Advisor
Community Advisor
February 18, 2022
Solved

Matching/reading numbers in a report

  • February 18, 2022
  • 2 replies
  • 1118 views

Hi, 

For the following report 

can you please confirm - how to read this?
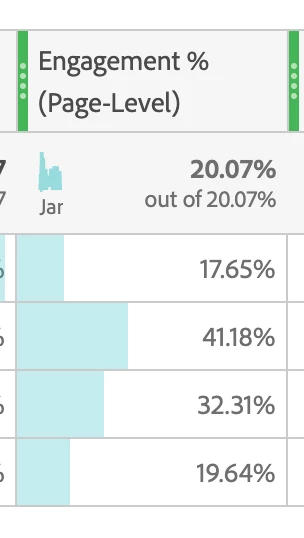
The total engagement% at the top shows 20.07%
but, when you take average of all four numbers (there are 4 rows only, nothing in unspecified) - the average is 27.69%, why not 20.07%
or if we add all the numbers, the total is 110 - why not 100%

can anyone please explain?

This post is no longer active and is closed to new replies. Need help? Start a new post to ask your question.
Best answer by yuhuisg

Your Engagement % is a calculated metric. So if you update your table to include the metrics that are used in the calculated metric, then you should be able to see how this Engagement % is calculated.

2 replies

Adobe Employee
February 18, 2022

Hi @vinay_chauhan , 

Can you please provide the screenshot having the dimension as well? 
This would depend on the column settings/row settings as well. 
If the percenatages are calculated row wise, the numbers would change. If they are calculated column wise, the numbers would change. You can also change the row/column settings via tha gear icon. 
In the meantime, here is the document you can refer. 

-Rhythm


Vinay_Chauhan
Community Advisor
Community Advisor
February 18, 2022

Hi @rhythmd,

Thanks for your reply.
This metric is mapped against the dimension called 'Page URL'.
Page URL has the list of four page urls, which are part of the segment.

Still not able to understand the numbers.
Gear option just shows how to hide and display numbers.

Thanks.

yuhuisg
Community Advisor
yuhuisgCommunity AdvisorAccepted solution
Community Advisor
February 20, 2022

Your Engagement % is a calculated metric. So if you update your table to include the metrics that are used in the calculated metric, then you should be able to see how this Engagement % is calculated.