Expand my Community achievements bar.

Webinar: Adobe Customer Journey Analytics Product Innovations: A Quarterly Overview. Come learn for the Adobe Analytics Product team who will be covering AJO reporting, Graph-based Stitching, guided analysis for CJA, and more!
SOLVED

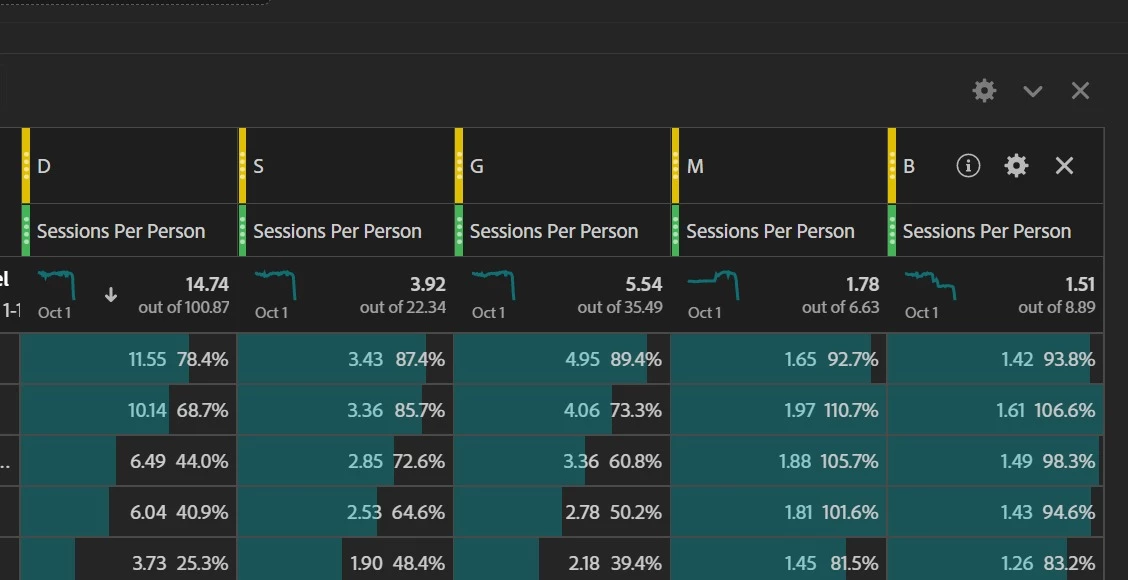
How to interpret these percentages? VERTICALLY or HORIZONTALLY not adding up to 100
Avatar

Level 1

WhatsApp Image 2022-10-05 at 1.41.00 PM.jpeg

1 Accepted Solution

Avatar

Correct answer by
Community Advisor

In each cell, the percentage is that cell's value out of the total value.

E.g. 11.55 = 78.4% of 14.74, 10.14 = 68.7% of 14.74, etc

Depending on the metric used, you can't always expect the rows' percentages to add up to 100%. In your case, it's just as you won't expect 11.55 + 10.14 + ... = 14.74 because of how your selected metric is calculated.

View solution in original post

2 Replies

Avatar

Community Advisor

I believe, based on your column headings of "Sessions per User"... there is data for each user in multiple rows... which will throw the percentage off...


In cases like these, I often hide the % and just let the background visualization show a relative weight.....

Avatar

Correct answer by
Community Advisor

In each cell, the percentage is that cell's value out of the total value.

E.g. 11.55 = 78.4% of 14.74, 10.14 = 68.7% of 14.74, etc

Depending on the metric used, you can't always expect the rows' percentages to add up to 100%. In your case, it's just as you won't expect 11.55 + 10.14 + ... = 14.74 because of how your selected metric is calculated.