Expand my Community achievements bar.

Webinar: Adobe Customer Journey Analytics Product Innovations: A Quarterly Overview. Come learn for the Adobe Analytics Product team who will be covering AJO reporting, Graph-based Stitching, guided analysis for CJA, and more!

has anyone used the 'Linear regression: Predicted Y' function ? pls help me to understand how it work?

Avatar

Level 1

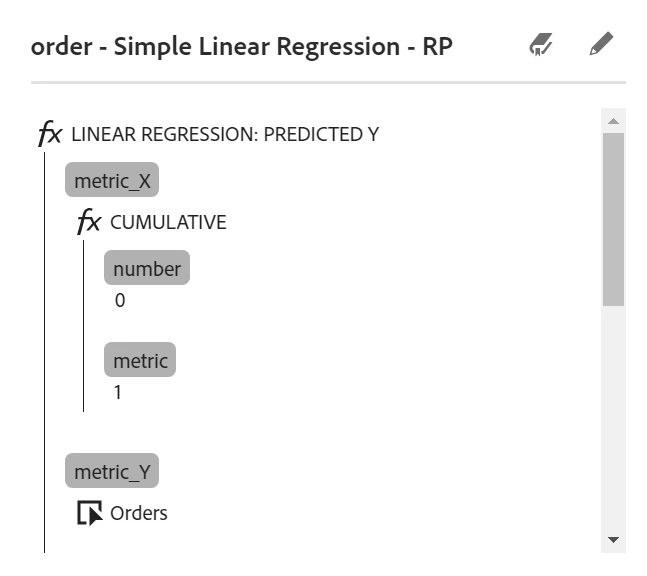
I have created the below metrics. However, I am not sure whether it is correct? and why predicted data keeps on changing?


RajeshwariPa1_0-1724833633953.png


8 Replies

Avatar

Community Advisor and Adobe Champion

Hi @RajeshwariPa1,

Generally, the purpose of a linear regression is to see how two variables are related to each other, by using the values of one to predict the values of another. For that, there are four pieces of data you need, the correlation coefficient, the slope, the intercept, and the predicted Y. Each of these gives you on part of the formula you need to predict values.


The predicted Y is the outcome of the regression formula. For example if you're using visits to predict how many orders will be placed on your site (using historical visit and order data), the predicted amount of orders will be the Y metric. So it does make sense that the predicted Y is constantly changing, because it depends on the historical data being used to determine the intercept, correlation coefficient, and the slope, and on the current value of X.


With what you have in your screenshot, you're using a cumulative value as your predictor, and it's predicting the number of orders that will be placed. So the Y you're seeing is the predicted order count, based on the formula.


I've actually just finished writing a playbook for adobe on how to use all 78 of the functions available in the metric builder (it should be published within the next couple months, I can come back and link it when it is published). Here is an excerpt from it about regressions.


Within each type of regression there are four functions: CORRELATION COEFFICIENT, INTERCEPT, PREDICTED Y, and SLOPE. Each of these will return a different part of the regression equation, Y = aX + b.


PREDICTED Y = Y

SLOPE = a

INTERCEPT = b

CORRELATION COEFFICIENT = Strength of the relationship between X and Y


The PREDICTED Y is the final result of the regression formula. In your table, for the given value of the X metric on a specific row, it will return what the predicted value is for the Y metric. This can be useful when you are missing data in a metric, and you want to estimate what it should be. The results of a regression are generally accurate, but there will be some differences between the predicted values and what the true value is due to natural variance.


The SLOPE (the “a” in the above formula) is the actual correlation between the two variables and is used in the calculation to predict Y based on the value of X.


The INTERCEPT (the “b” in the above formula) is used to raise/lower the predicted values. If the metric X is 0, the predicted Y value would be equal to this intercept. Along with the slope, it is used to help predict the Y values.


The CORRELATION COEFFICIENT returns a value that indicates how strongly two metrics are associated with each other. It will return a value between -1 and +1. The further from zero the number is, the stronger the two metrics are related. If the result is positive that means when one metric increases, so does the other. If the result is negative that means when one metric increases the other decreases.

Avatar

Level 1

Hello @MandyGeorge,


Thank you so much for the reply and explanations. I guess I need to go through this again. 


However, Can you please help me understand for some days data is showing negative.? is it has any relation between the upper right hand date range selection?


RajeshwariPa1_0-1724929689916.png


Avatar

Community Advisor and Adobe Champion

@RajeshwariPa1 can you share how you built the two metrics that are going negative?


If that is the Y value metric, then it's a predicted amount based on your predictor variable. If it's using the same as above then it's using the cumulative to predict orders, so you might have a table that looks like this

Cumulative   Orders

1                      10

2                       8

3                       6

4                       2

5                       1


The regression would be Y = mX + b

The "m" and "b" would be the slope and the intercept calculated by those values. The X would be your predictor (cumulative), and the Y would be the predicted amount of orders.

If your data looked something like that, then a value of 6 (or higher) for X would likely product a negative Y value.


So you need to think about what you're using as your predictor and what you want to estimate as the outcome. Without seeing what variables you have in the metric builder, it's hard to be more specific than that.

Avatar

Level 1

Thank you. @MandyGeorge .


Request to confirm whether the existing 'Linear regression: Predicted Y' function is built with all the other formulas? like Slope and intercept.

Avatar

Community Advisor and Adobe Champion

Hi @RajeshwariPa1, all four of the linear regression functions are a part of the same formula, that's why the builder is the same for each of them. The difference is what they output. 

They're all using the regression formula Y = mX + b

Your slope is going to output the "m"

Your intercept is going to output the "b"

Your Predicted Y is going to output the "Y"

Your correlation coefficient is going to return the relationship between X and Y 


Let's look at this using an example. In the table below I'm using Visits as my "X" variable and Orders as my "Y". Meaning that I'm trying to predict the number of orders that will be placed using the regression formula.


Columns 1 and 2 are the actual visit and order amounts.

Column 3 is the correlation coefficient. This is the strength of the relationship between X and Y. It's going to be the same in every row because it takes the all of the values into account to determine the relationship. The closer it is to 1, the stronger the relationship. If the number is positive that means that when one metric goes up the other goes up too, if it's negative that means when one metric goes up, the other goes down.

Columns 5 and 6 are your slope and intercept. Again, these are the same in every row because it's taking all of the values into account to determine the formula.


Column 4 is the one you're interested in, that's the predicted Y. In our example, it's the predicted amount of orders. So putting the numbers into Y = mX + b, we would get Y = 0.09X + -251.17.

If we put our X value into the equation, it will be different for each row, because it's the actual amount of visits for the day. Meaning the output for the Y is also going to be different each day, because it's the predicted amount of orders based on the visits.


If you compare column 4 (predicted orders) to column 2 (actual orders), you can see it isn't exact, but it's pretty close. The reason it isn't exact is because it isn't a 1 to 1 relationship (the relationship between the two variables is 0.92, which is actually pretty strong)


MandyGeorge_0-1725028939590.png


In conclusion - using the predicted Y is going to give you an estimated amount for a metric based on another metric, such as using visits to predict orders. So the predicted Y does take into account the entire regression formula to make it's estimate (include slope and intercept).


Avatar

Level 1

@MandyGeorge I really Appreciate the effort you took to explaining the formula.


Thank you so much. It is very much clear now. Once again thanks a lot..