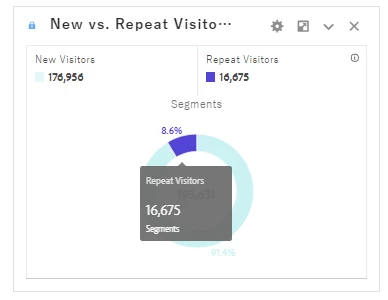
Difference in Repeat Visitor Rate between single month and single year
I would like to confirm "Repeat Visitors Rate" for a website I manage. The Repeat Visitors Rate was calculated by Number of Repeat Visitors/ Number of unique visitors. However, there is a large discrepancy when comparing this Rate between a single month and a single year in Adobe analytics.
When looking at a single month, the average Repeat Visitors Rate is about 23%, but when the date range is annual (year), the rate is 8.6%.
When I check the data, we see that the number of "Repeat Visitors" has decreased significantly.
The total number of Repeat Visitors for the 12-month period should be 106,232, but the pie chart shows 16,675.
In general, it would be expected the number of repeat visitors to increase as the time period is extended, but why is it decreasing?


