Expand my Community achievements bar.

Join us at Adobe Summit 2024 for the Coffee Break Q&A Live series, a unique opportunity to network with and learn from expert users, the Adobe product team, and Adobe partners in a small group, 30 minute AMA conversations.
SOLVED

Conversion from Page A to Page B - Best Practices

Avatar

Level 2

Hi,

I wanted to know what is the best practice or correct calculated metric to look at conversion from Page A to Page B.

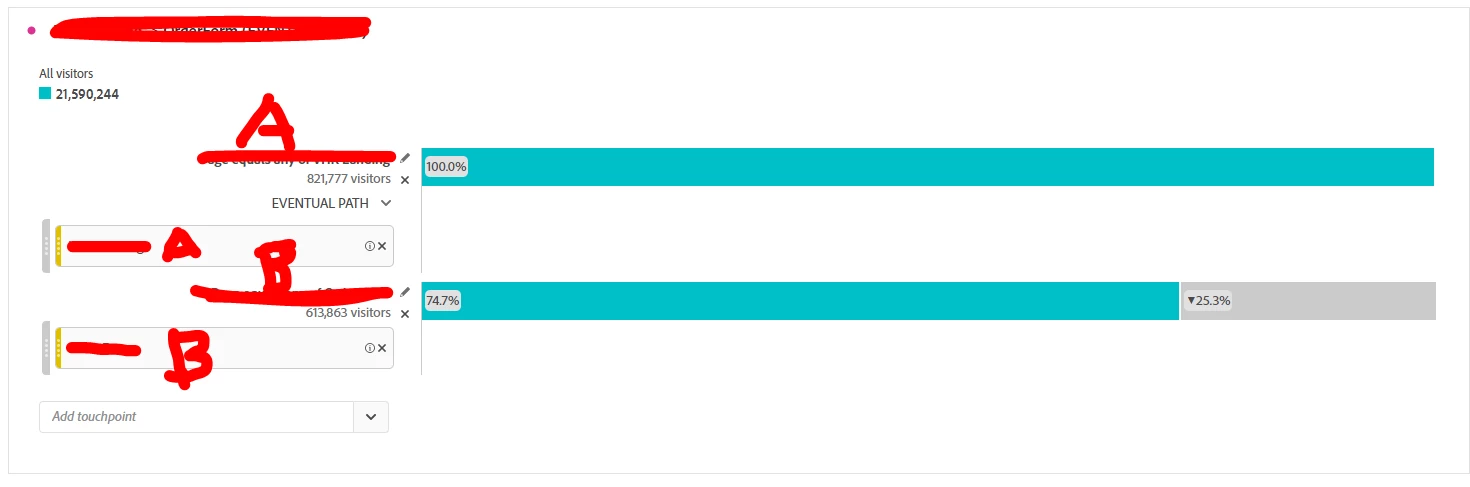
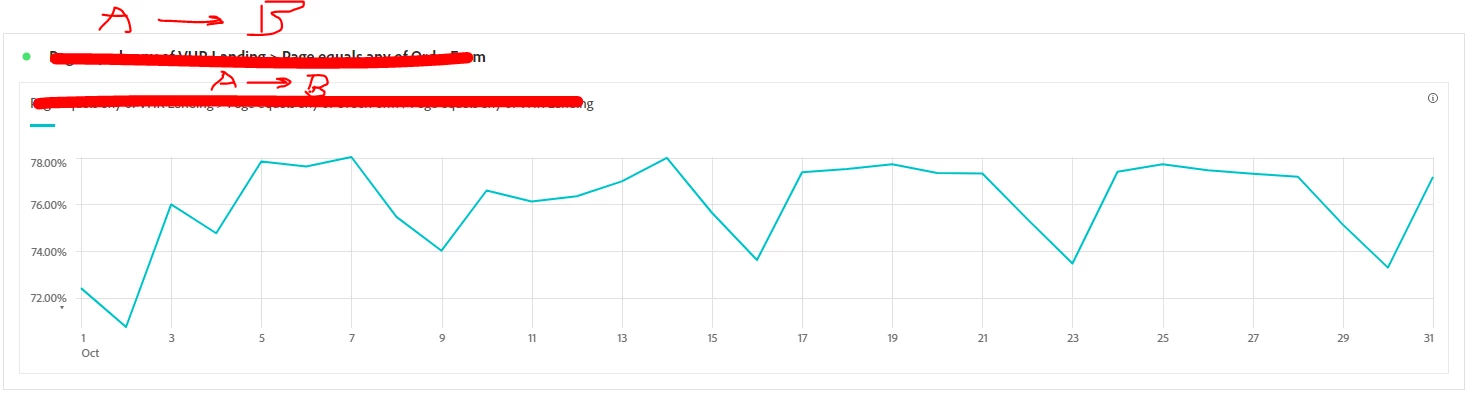
I used a funnel in workspace and looked at Page A -> Page B for both eventual path and next hit and used the trend touchpoint to show by day in a graph.

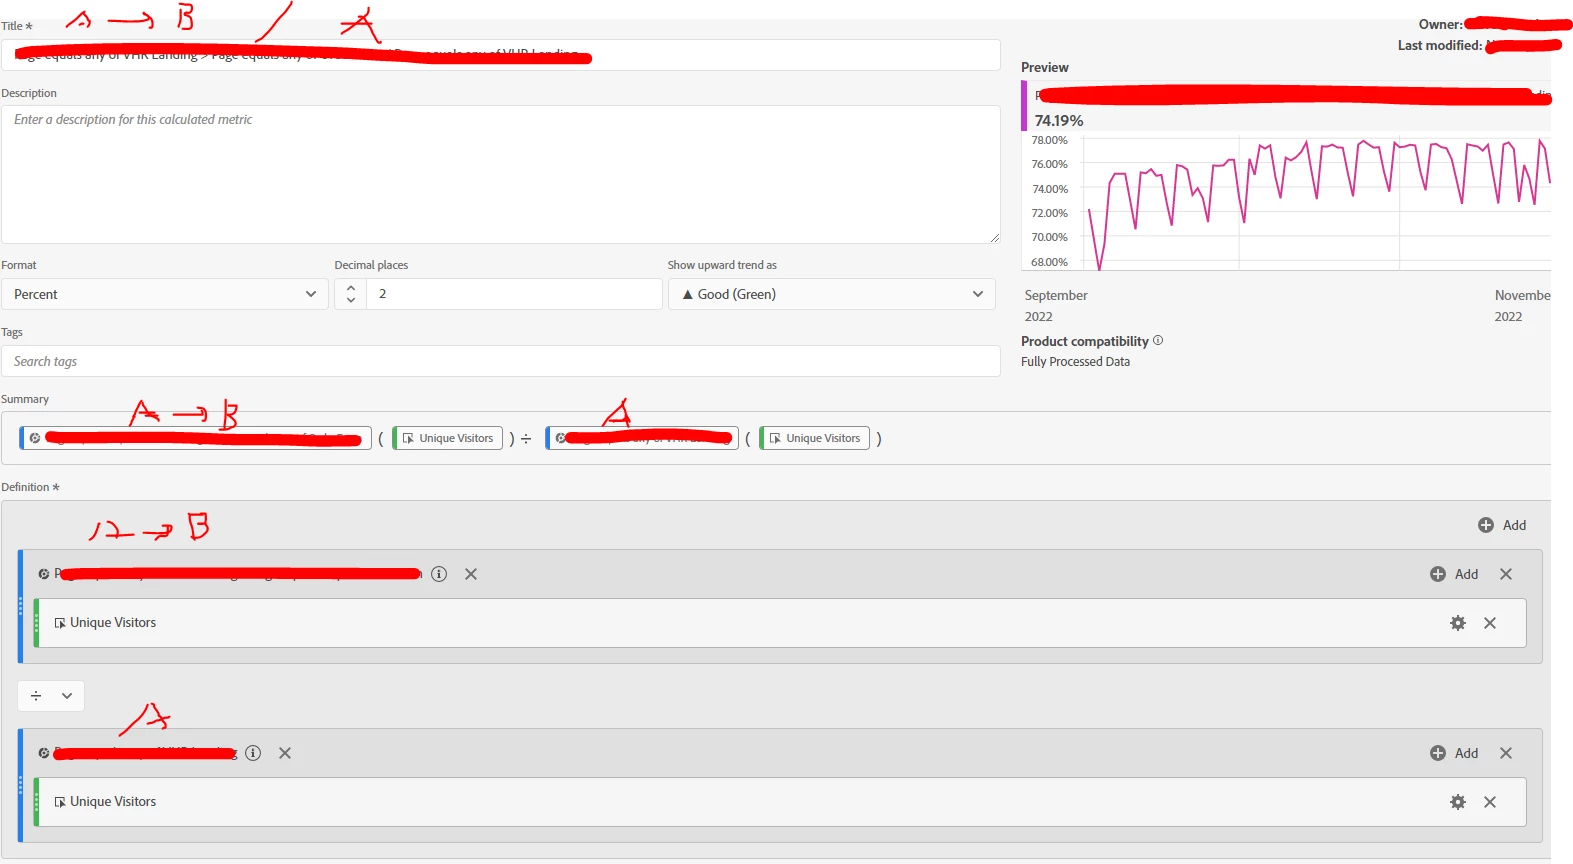
I'm wondering if this is the best practice for this or if I should created a calculated metric instead? I noticed it doesn't break down the segment on the visit level for the conversion funnel so maybe it's just a matter of choice 1 vs. choice 2, but i wanted to know your thoughts.

If an example could be provided, that would be awesome!

Thanks!

skatofia_0-1669824040259.png

skatofia_1-1669824085604.png

skatofia_0-1669824338951.png

1 Accepted Solution

Avatar

Correct answer by
Community Advisor

One thing to keep in mind is that the fallout reports restrict users to MUST hit A before they hit B (this isn't the case in your own calculated metrics).

However, I actually prefer to do my own calculated metrics... this way I am not locked to UV/UV - I can do custom conversions like "Users who Convert / Total Element Impressions". With Custom Conversions you can also do breakdowns by more than just day depending on what you are looking at... and you can have multiple columns of conversions side by side in a table....

It really depends what you need and how you want to present it. There is no "right way" aside from what is "right for you".

I will use fallouts in some reports, and custom calculations in others... but also, my marketing team likes to see the actual percentages per week (and custom Monday to Sunday weeks at that), not just a graph... so I have to do a calculated metric to show the data in a freeform table and break it down by multiple custom date ranges).

View solution in original post

2 Replies

Avatar

Correct answer by
Community Advisor

One thing to keep in mind is that the fallout reports restrict users to MUST hit A before they hit B (this isn't the case in your own calculated metrics).

However, I actually prefer to do my own calculated metrics... this way I am not locked to UV/UV - I can do custom conversions like "Users who Convert / Total Element Impressions". With Custom Conversions you can also do breakdowns by more than just day depending on what you are looking at... and you can have multiple columns of conversions side by side in a table....

It really depends what you need and how you want to present it. There is no "right way" aside from what is "right for you".

I will use fallouts in some reports, and custom calculations in others... but also, my marketing team likes to see the actual percentages per week (and custom Monday to Sunday weeks at that), not just a graph... so I have to do a calculated metric to show the data in a freeform table and break it down by multiple custom date ranges).

Avatar

Level 2

Thanks @Jennifer_Dungan!

For my fallout chart, I have "visitors" selected and "eventual path" selected for Page A -> Page B. My time frame is Nov. 1-30. Does this mean that users hit Page A and then hit Page B at any point in November? Or is this specific to a visit? The way I interpret it now is it could be within the same visit (Next hit or not) and/or across multiple visits in November. Let me know whether this is the case or not.

Also, if I wanted to look at visitors from Page A to Page B within the same visit on a visitor conversion level, how could I do that?

I also referred to this, but was a little confused in combining eventual path and visitor. https://experienceleague.adobe.com/docs/analytics-platform/using/cja-workspace/visualizations/fallou...

skatofia_0-1669906379246.png