
Introduce "build table" option for visualizations
Description -
Many visualizations in Analysis Workspace are based on Freeform tables. Some of those visualizations, like the Histogram viz, can therefore be used to create complex Segments or Freeform tables from a simple interface. That's awesome!
However, not all visualizations are based on Freeform tables and don't offer a quick way to take the generated data a step further. Luckily, those visualizations usually offer some form of right-click magic to create single tables or Segments, which is a concept I would like to extend on.
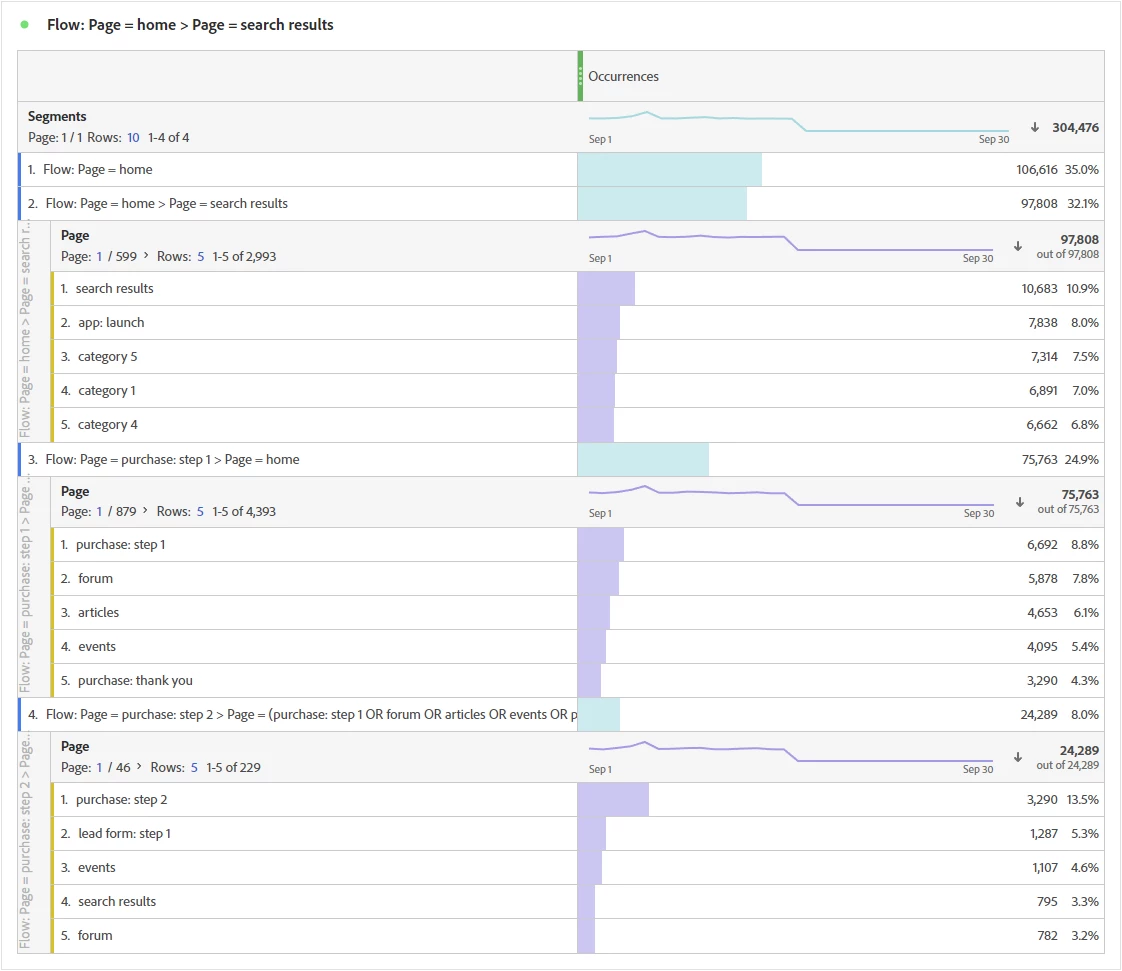
For example, consider this Flow viz:
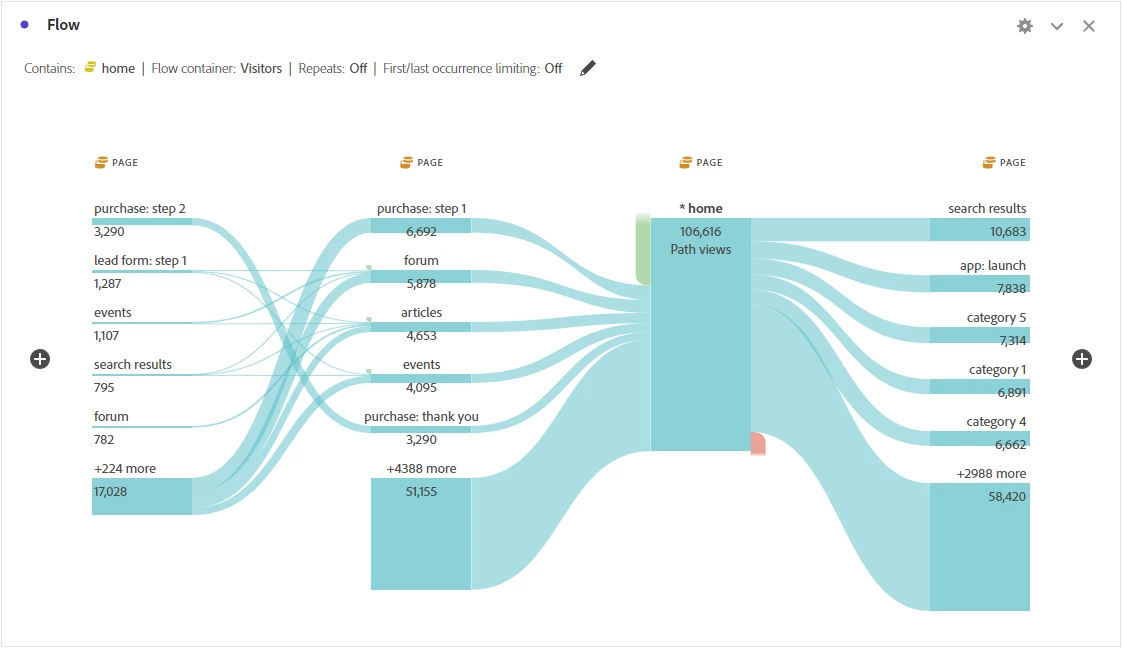
We can right-click individual nodes to break it down but not show a full column (only when we hack it to show a full table) or even the full viz as a table. This could be added quite easily with some new buttons to show the full Flow or just a single column as a table:
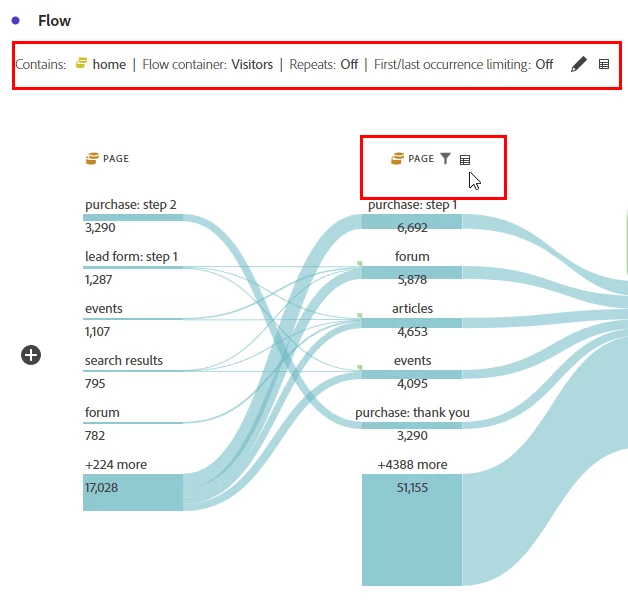
Clicking those would create a new Freeform table with the respective Segment(s), dimension, and metric applied, potentially like this:
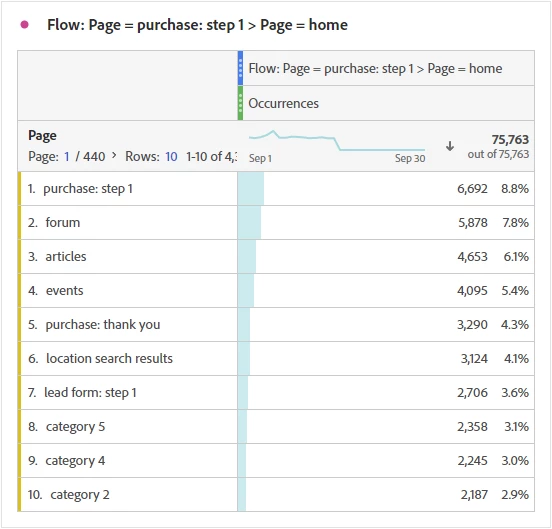
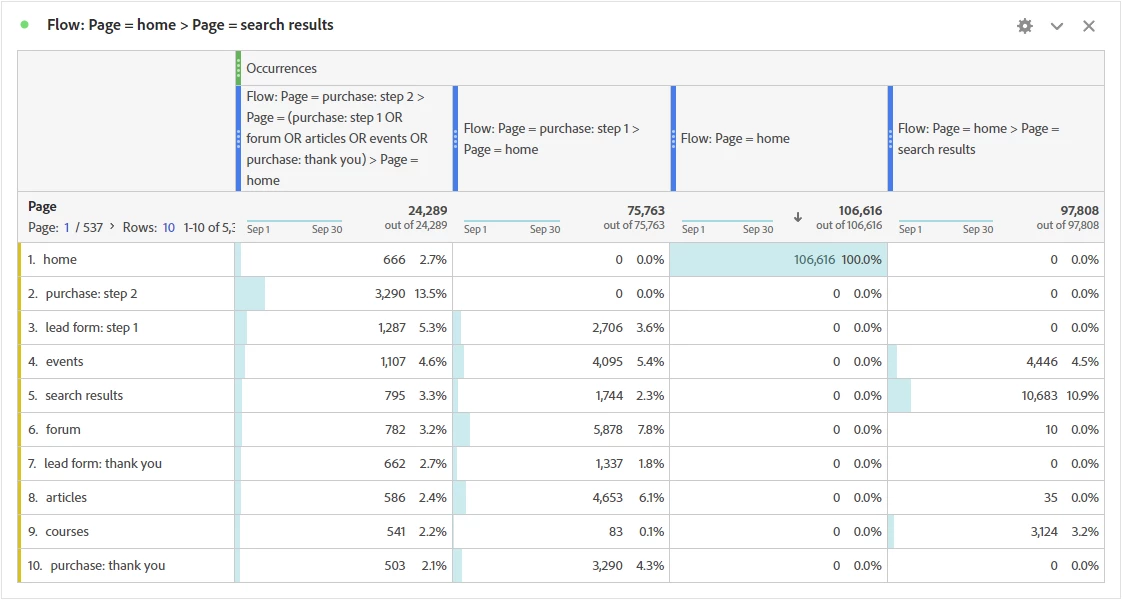
This view would make it very easy for users to build further dashboards and reports based on those very complex Segments. The same principle could be applied to other visualizations, like:
- The Cohort Table, to make the creation of retention Segments super quick and easy
- The Fallout viz, to easily monitor funnel performance and build audiences for specific audiences