New
Analytics Workspace > Line Graphs > Select the evar(s) to use for Legend labels to clean up report
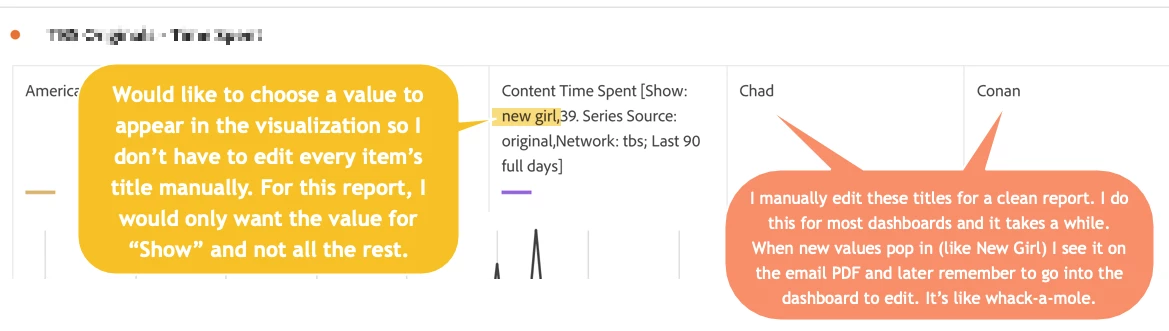
I'd like the option to choose which eVar's value should appear as a label for a graph (see visual below.) When there are lots of stacked variables or filters applied, the label gets quite unwieldy. I spend a lot of time manually updating the values that appear in line charts.
In the case below, I would choose "Show" as the variable to appear as the label. I'd set it and forget it. Currently, each time a new show cracks the top 5 line items that appear on the graph I have to remember to go in and clean up its name.
Thank you in advance, Jenn!