

How Workfront Cleaned Up Its Own Unbridled Instance of Workfront
Times change. People change. Processes change. And we must change with them. Nearly every customer that has used Workfront for more than two years realizes that what they implemented initially doesn’t match how they do things today; that what their leadership wanted years ago doesn’t align with what leadership wants today; and that the tidy, easy-to-manage system they once had has become overgrown with thousands of outdated and unused templates, reports, request queues and custom fields.
In the spring of 2019, Workfront was no different. As a company, we are our oldest customer. We’ve used our work management software longer than any organization in the world. And we developed some bad habits along the way.
For nearly two decades, our instance of Workfront has been the sandbox and test kitchen for hundreds of product managers, engineers, consultants and system administrators. Every one of our 1000+ employees had a plan license, giving them unfettered freedom to create as many real and “test” projects, templates, custom forms, reports and dashboards as they liked. Our own production instance of Workfront became so unwieldy, some people stopped using it. And for a software company built on helping people do their best work, that was a real problem.
And so we launched an initiative called Done Right at Workfront (DR@WF) and its first focus was a major, well, a massive Workfront cleanup. We knew that if we were going to provide best practices on Modern Work, we needed to get our own environment in order before we started guiding our customers and partners to do the same. And by summer 2019, with a focused, collaborative effort, here were some of the results:
27 system administrators to 5
75,432 active users to 7,814
105 home groups to 10
68,108 active project to 7,862
20% job roles assigned to 100%
10% layout template assignment to 100%
137 request queues to 21
These wins represent only a small portion of what was accomplished with the deep clean and what we plan to do. So how did we do it? Here are some of the best Workfront cleanup practices and lessons learned along the way.
Workfront Cleanup Best Practices and Lessons Learned
1. Establish a governance committee
Start by establishing a governance committee - Modern_Work_Governance.pdf. Your governance committee should be comprised of 2-3 system administrators and 4-7 group administrators which provide departmental business perspective, assist with establishing naming conventions, while also being responsible for cleaning up the items that belong to their group. The first lesson we learned was – if you want the cleanup effort to be a success, don’t do it alone!
Once the governance committee is in place, start to lock down access levels. Minimize the ability for plan licenses to create or edit portfolios, programs and custom forms. These should be driven by and advised by group administrators.
2. Create a Workfront cleanup project template
Assign the Workfront cleanup project template and customize it to each of the departments and group administrators. This is the one we used in our efforts.
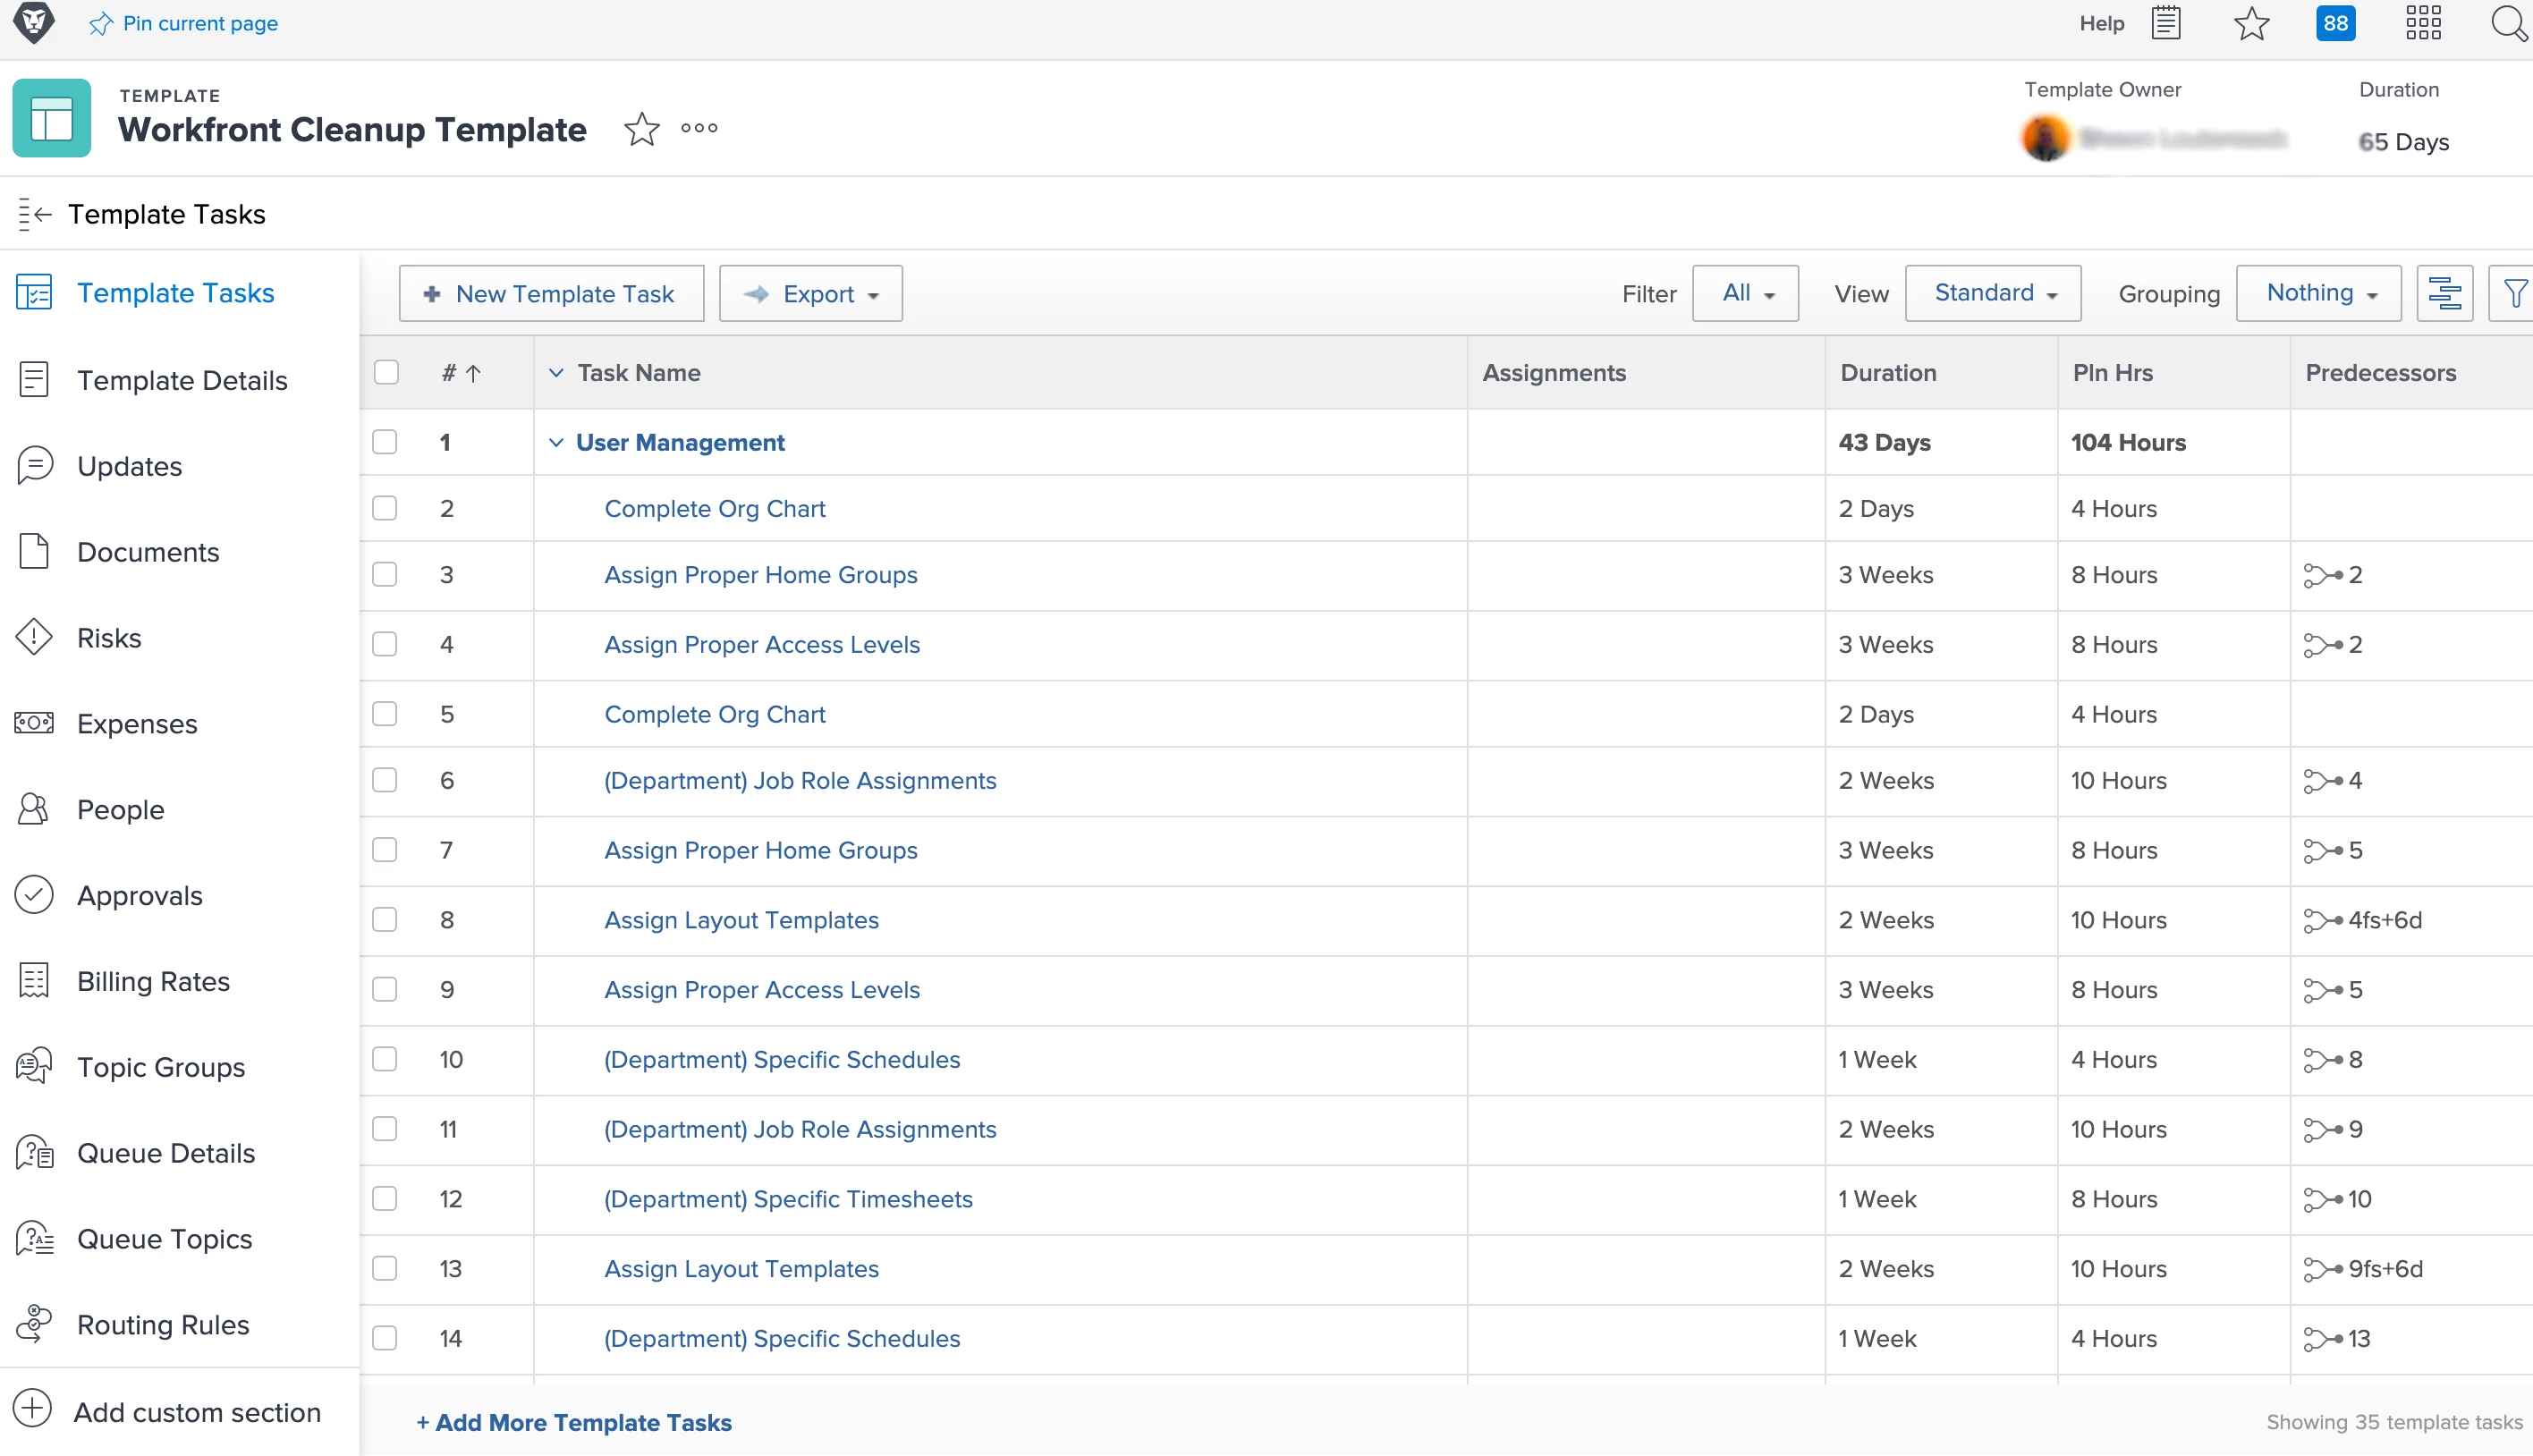
As you can see, we strongly recommend you start with user management. It makes everything that follows that much easier. And remember, a best practice is to always deactivate, not delete, a user in order to preserve any information associated with that user.
3. Communicate efforts
As your efforts get underway, let the entire organization know what you’re doing. Let them know that you’ve created a governance board, who is on the board, that your initial focus will be a cleanup effort and what the outcome and the benefit of the cleanup effort will be. Give them periodic updates on your progress and solicit their feedback about your Workfront instance.
One of the key tenets of our organizational change is to measure the impact of our efforts. For this program, we wanted to understand how our employees' user experience would improve just through a clean up effort. To measure it, we conducted a pre-cleanup baseline using the following questions (we call our instance of Workfront - Hub):
What department are you in?
Based on your experience in Hub, how likely are you to recommend Workfront to a colleague or friend?
What do you find most frustrating about Hub?
What's working for you in Hub, and why?
How could Hub be improved to help you do your best work?
How often do you use Hub?
What percentage of your work is managed in Hub?
Which principle from the book Done Right by Alex Shootman has most helped you get your work done?
How have you put the principle into practice?
May we contact you about your ideas and recommendations?
Your name:
The second question in the survey determines a Net Promoter Score. Based on the results, you can calculate an NPS score for your Workfront instance using this calculator (https://delighted.com/nps-calculator). The goal is to improve it over time, based on responding to the comments you receive.
4. Keep up the momentum!
Create two-week sprints with specific cleanup assignments for the group administrators. Review your progress with a dashboard in a bi-weekly or monthly meeting and discuss any issues or roadblocks your team is experiencing. The primary system administrator should act as the project manager and supporting resource.
Check out the configuration details of our Workfront Cleanup dashboard reports below.
5. Utilize the newer functionalities
As you consider some of the global settings and statuses, utilize some of the newer functionality like subgroups, e.g. marketing subgroup, creative services subgroup, etc. You can delete global settings and statuses that were group specific and add them at the group level.
6. Create a request queue
Create a request queue to funnel all future Workfront-related ideas, concerns and issues. Route the requests to the governance committee and establish protocols for how to manage and make decisions on them. We created reports to easily view and work through all the requests we receive. Announce the request queue to your organization and let them know it is the best way for you to track and respond to their ideas and issues.
7. Create a departing employee dashboard
An important part of good hygiene in Workfront is managing, reassigning or deleting work that is owned by employees who are leaving the organization. A gap in this process will result in dozens to hundreds of projects, documents, templates, reports, issues and tasks that are orphaned in the environment, left uncompleted and creating an inaccurate view of the work taking place in the organization. This departing employee dashboard ensures you cleanup or reassign the various items attached and assigned to departing employees week by week, month by month.
Check out the configuration details of our departing employee dashboard reports below.
8. Make use of the delete button
At a certain threshold, you’ll want to determine when to yield the powerful delete button. As a beginning, Workfront decided we would delete any project that 1) was untitled, or 2) was titled “test,” or 3) the project owner had not been with the company for 3+ years and the project wasn’t tied to revenue, e.g. a professional service project.
Starting with the easiest deletion candidates is a great way to get some early victories and momentum for the clean up effort before digging into the more nuanced objects.
Keep in mind, Workfront is your OSR - Operational System of Record. Your governance board should set the threshold for how far back it wants a view into historical work.
9. Edit projects in bulk
If you have hundreds of projects where all of the tasks and issues are complete, but the project is not marked as complete and you’d like to mark all them as complete, here is a time saving tip – edit the projects in bulk, changing the completion mode field to manual. This will automatically complete all projects in which all tasks and issues have been completed. You can then bulk edit the remaining projects as “dead”.
We set the threshold of marking projects as complete or dead if the project was incomplete and hadn’t been updated in 2+ years.
10. Tell your teams to filter reports
Once everything is cleaned up, be sure to advise your teams to filter their reports and view filters to show “active,” since many objects will still exist, but will be marked complete, dead or deactivated.
11. Enable your teams to do their own, personal cleanup
Share the Personal Activity Dashboard below (with the accompanying message) to enable your teams to keep their own items in Workfront current and up-to-date.
Although it is an effort that requires several weeks of focus, cleaning up your Workfront instance and aligning workflows and objects with current leadership and objectives will renew your organization’s ability do its best work.
We hope sharing these best practices and our approach to governance will ensure you and your team will experience a smooth and successful cleanup effort while creating a framework for ongoing maintenance and process improvement.
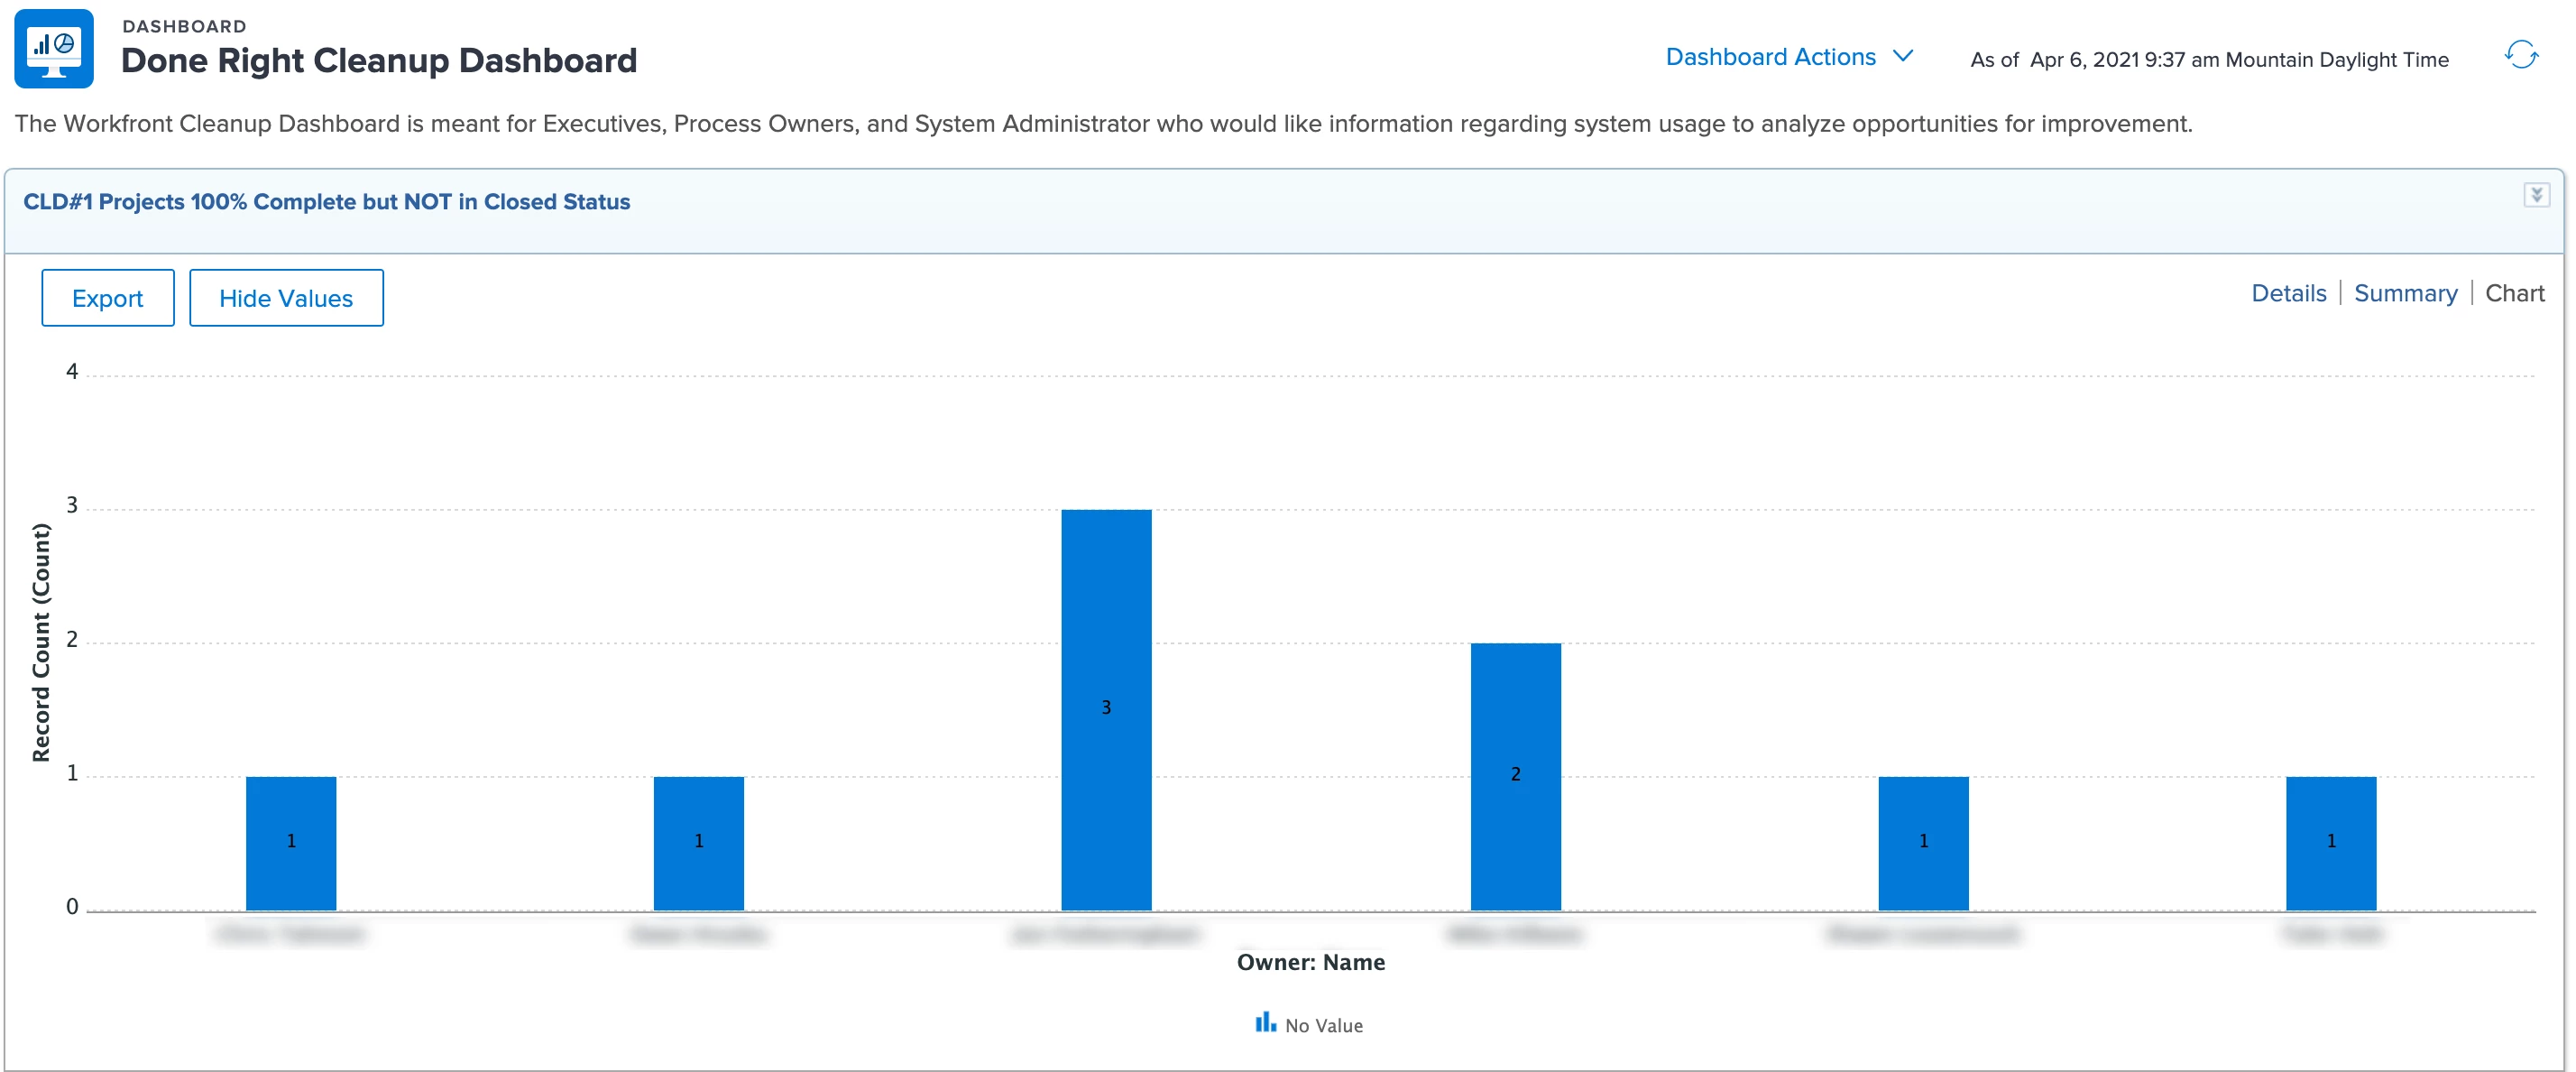
Workfront Cleanup Dashboard
As you create these reports and add them to the cleanup dashboard, we recommend adding the name of the department to the beginning of each report’s name, e.g. Marketing Projects 100% Complete but NOT in Closed Status.
Projects 100% Complete but NOT in Closed Status
- Project Report
- Filtered By
- Owner Home Group ID in (Group IDs)
- and Percent Complete equal (case sensitive) 100
- and Status not in Complete, Dead
- Prompt: N/A
- Output: Column Chart
- Grouping: Owner Name
- Column Fields: Name, Owner, Description, Due On, % Complete, Status, Last Update Date
- Summary: Identify projects that should be completed and are not. To help ensure users are not distracted by excess work data on their dashboards, old projects should be marked dead, completed or deleted.
Number of Projects by Template
- Project Report
- Owner Home Group ID in (Home IDs)
- Prompt: N/A
- Output: Column Chart
- Grouping: Template Name
- Column Fields: Name, Owner, Description, Due On, % Complete, Template Name
- Summary: Display how many projects have been created in the system, grouped by their template. This can be useful to determine the projects with no template or templates with low usage that could potentially be deleted or archived. Projects in the “No Value” column were created without using a template which may present a governance problem.
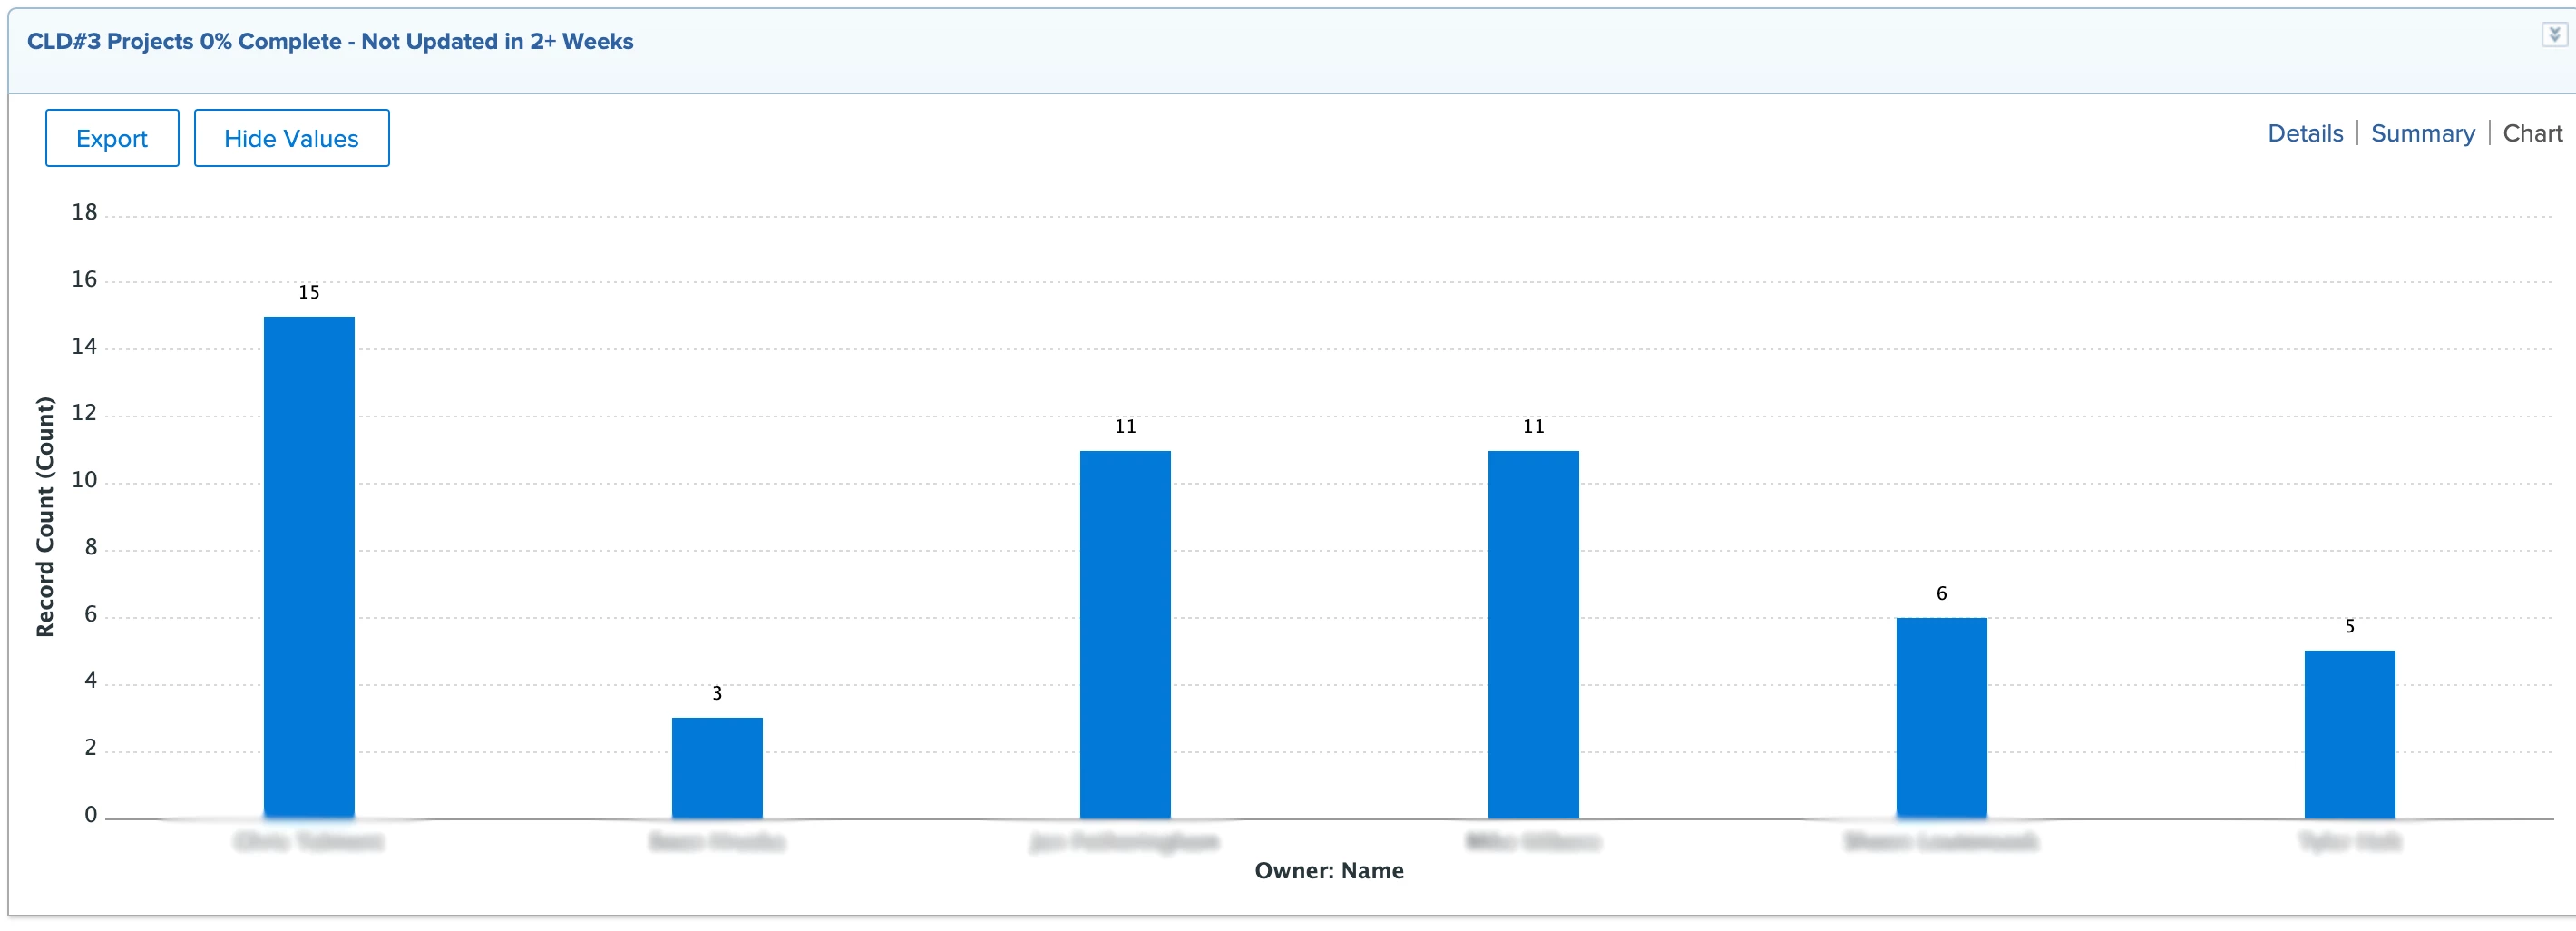
Projects 0% Complete - Not Updated in 3+ Weeks
- Project Report
- Filtered By
- Last Update Date less than $$TODAY-3w
- and Owner Home Group ID in (Owner Home Group IDs)
- and Percent Complete equal (case sensitive) 0
- Prompt: N/A
- Output: Column Chart
- Grouping: Owner Name
- Column Fields: Name, Owner, Description, Due On, % Complete, Last Update Date
- Summary: Identify projects that are not being used. To help ensure users are not distracted by excess work data on their dashboards, unused projects should be marked as on hold, completed, or deleted.
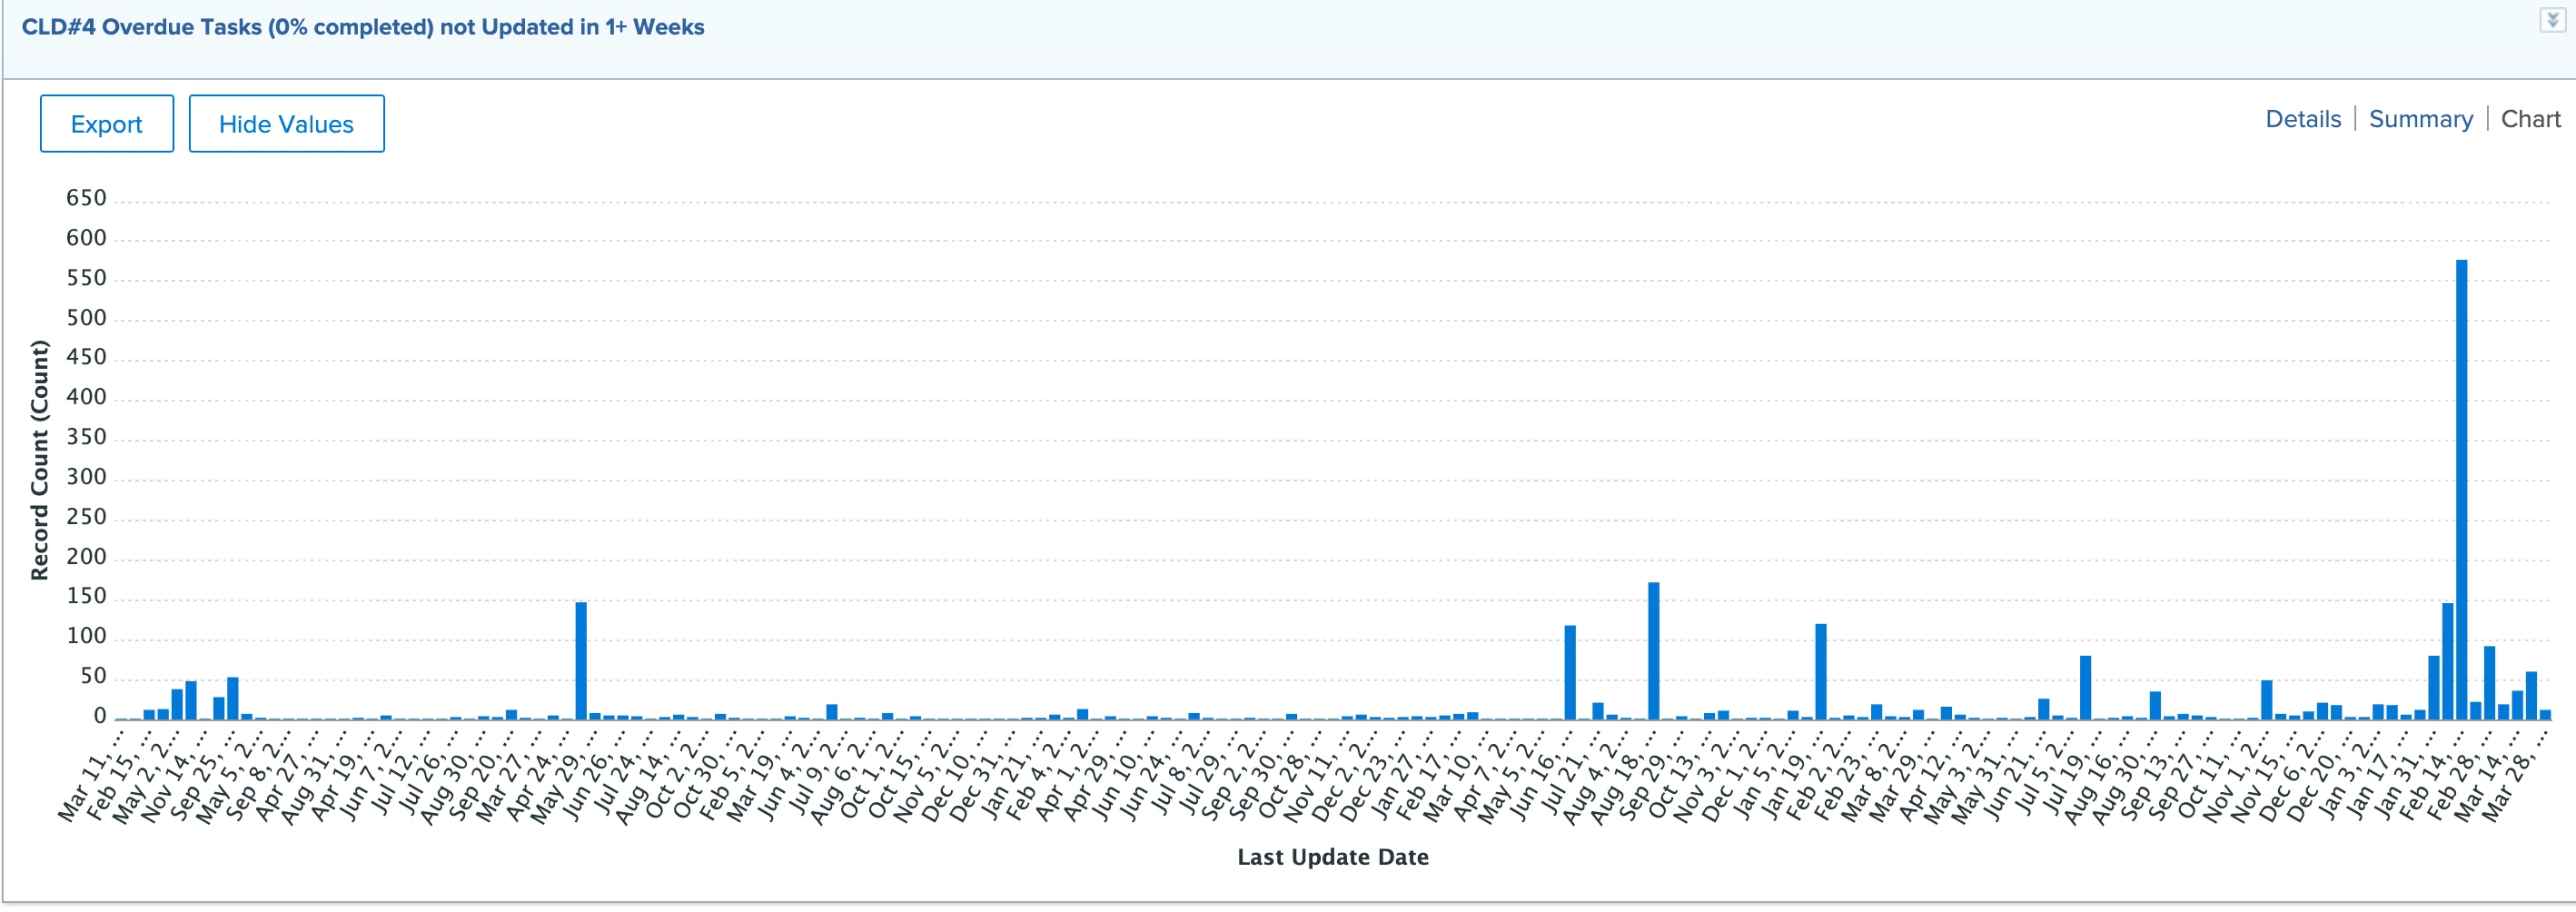
Overdue Tasks (0% completed) not Updated in 3+ Weeks
- Task Report
- Filtered By
- Assigned To Home Group ID in (Home Group IDs)
- and Last Update Date less than $$TODAY-3w
- and Percent Complete equal (case sensitive) 0
- and Planned Completion Date less than $$TODAY
- Prompt: N/A
- Output: Column Chart
- Grouping: Last Update Date (by week)
- Column Fields: Name, Assignments, Duration, Start On, Due On, % Complete, Last Update Date
- Summary: Identify tasks that should potentially be completed and are not. To help ensure users are not distracted by excess work data on their dashboards, old tasks should be completed, canceled, or deleted.
Users by Layout Template
- User Report
- Filtered By
- Home Group ID in (Home Group IDs)
- and Is Active equal (case sensitive) true
- Prompt: N/A
- Output: Column Chart
- Grouping: Layout Template Name
- Column Fields: Photo, Access Level, Title, Job Role, Home Group, Home Team, Company, Layout Template
- Summary: This report will show which Layout Templates are used the most/least. This can be used to help aid data cleanup and persona user interface management.
- Tip: Some Layout Templates may be applied using Groups, Teams, or Companies rather than Users themselves.
Request Queue Issues by Queue Topic
- Issue Report
- Filtered By
- Assigned To Home Group ID in (Home Group IDs)
- and Queue Definition Is Public in 3, 4, 2, 1
- Prompt: N/A
- Output: Column Chart
- Grouping: Project Name and Queue Topic Name
- Column Fields: Project Name, Issue Name, Entry, Entered by Name
- Summary: Displays how many issues/requests have been created in the system to date, grouped by their Queue Topic. This can be useful to determine old/unused queue topics that may need to be cleaned up/removed.
Project Issues (Non-Request Queue) by Queue Topic
- Issue Report
- Filtered By
- Assigned To Home Group ID in (Home Group IDs)
- and Queue Definition Is Public in 0
- Prompt: N/A
- Output: Column Chart
- Grouping: Queue Topic Name
- Column Fields: Project Name, Issue Name, Entry, Entered by Name
- Summary: Displays how many issues/requests have been created in the system to date, grouped by their queue topic. This can be useful to determine old/unused queue topics that may need to be cleaned up/removed. This is most commonly used when marketing teams use Master Projects for Campaigns.
Project Issues by Queue Topic (with Resolving Project)
- Issue Report
- Filtered By
- Assigned To Home Group ID in (Home Group IDs)
- and Queue Definition Is Public in 0
- and Resolve Project ID is not blank
- Prompt: N/A
- Output: Column Chart
- Grouping: Queue Topic Name
- Column Fields: Project Name, Issue Name, Entry, Entered by Name
- Summary: This report will show how many issues/requests have been created in the system to date, grouped by their queue topic. This can be useful to determine old/unused queue topics that may need to be cleaned up/removed.
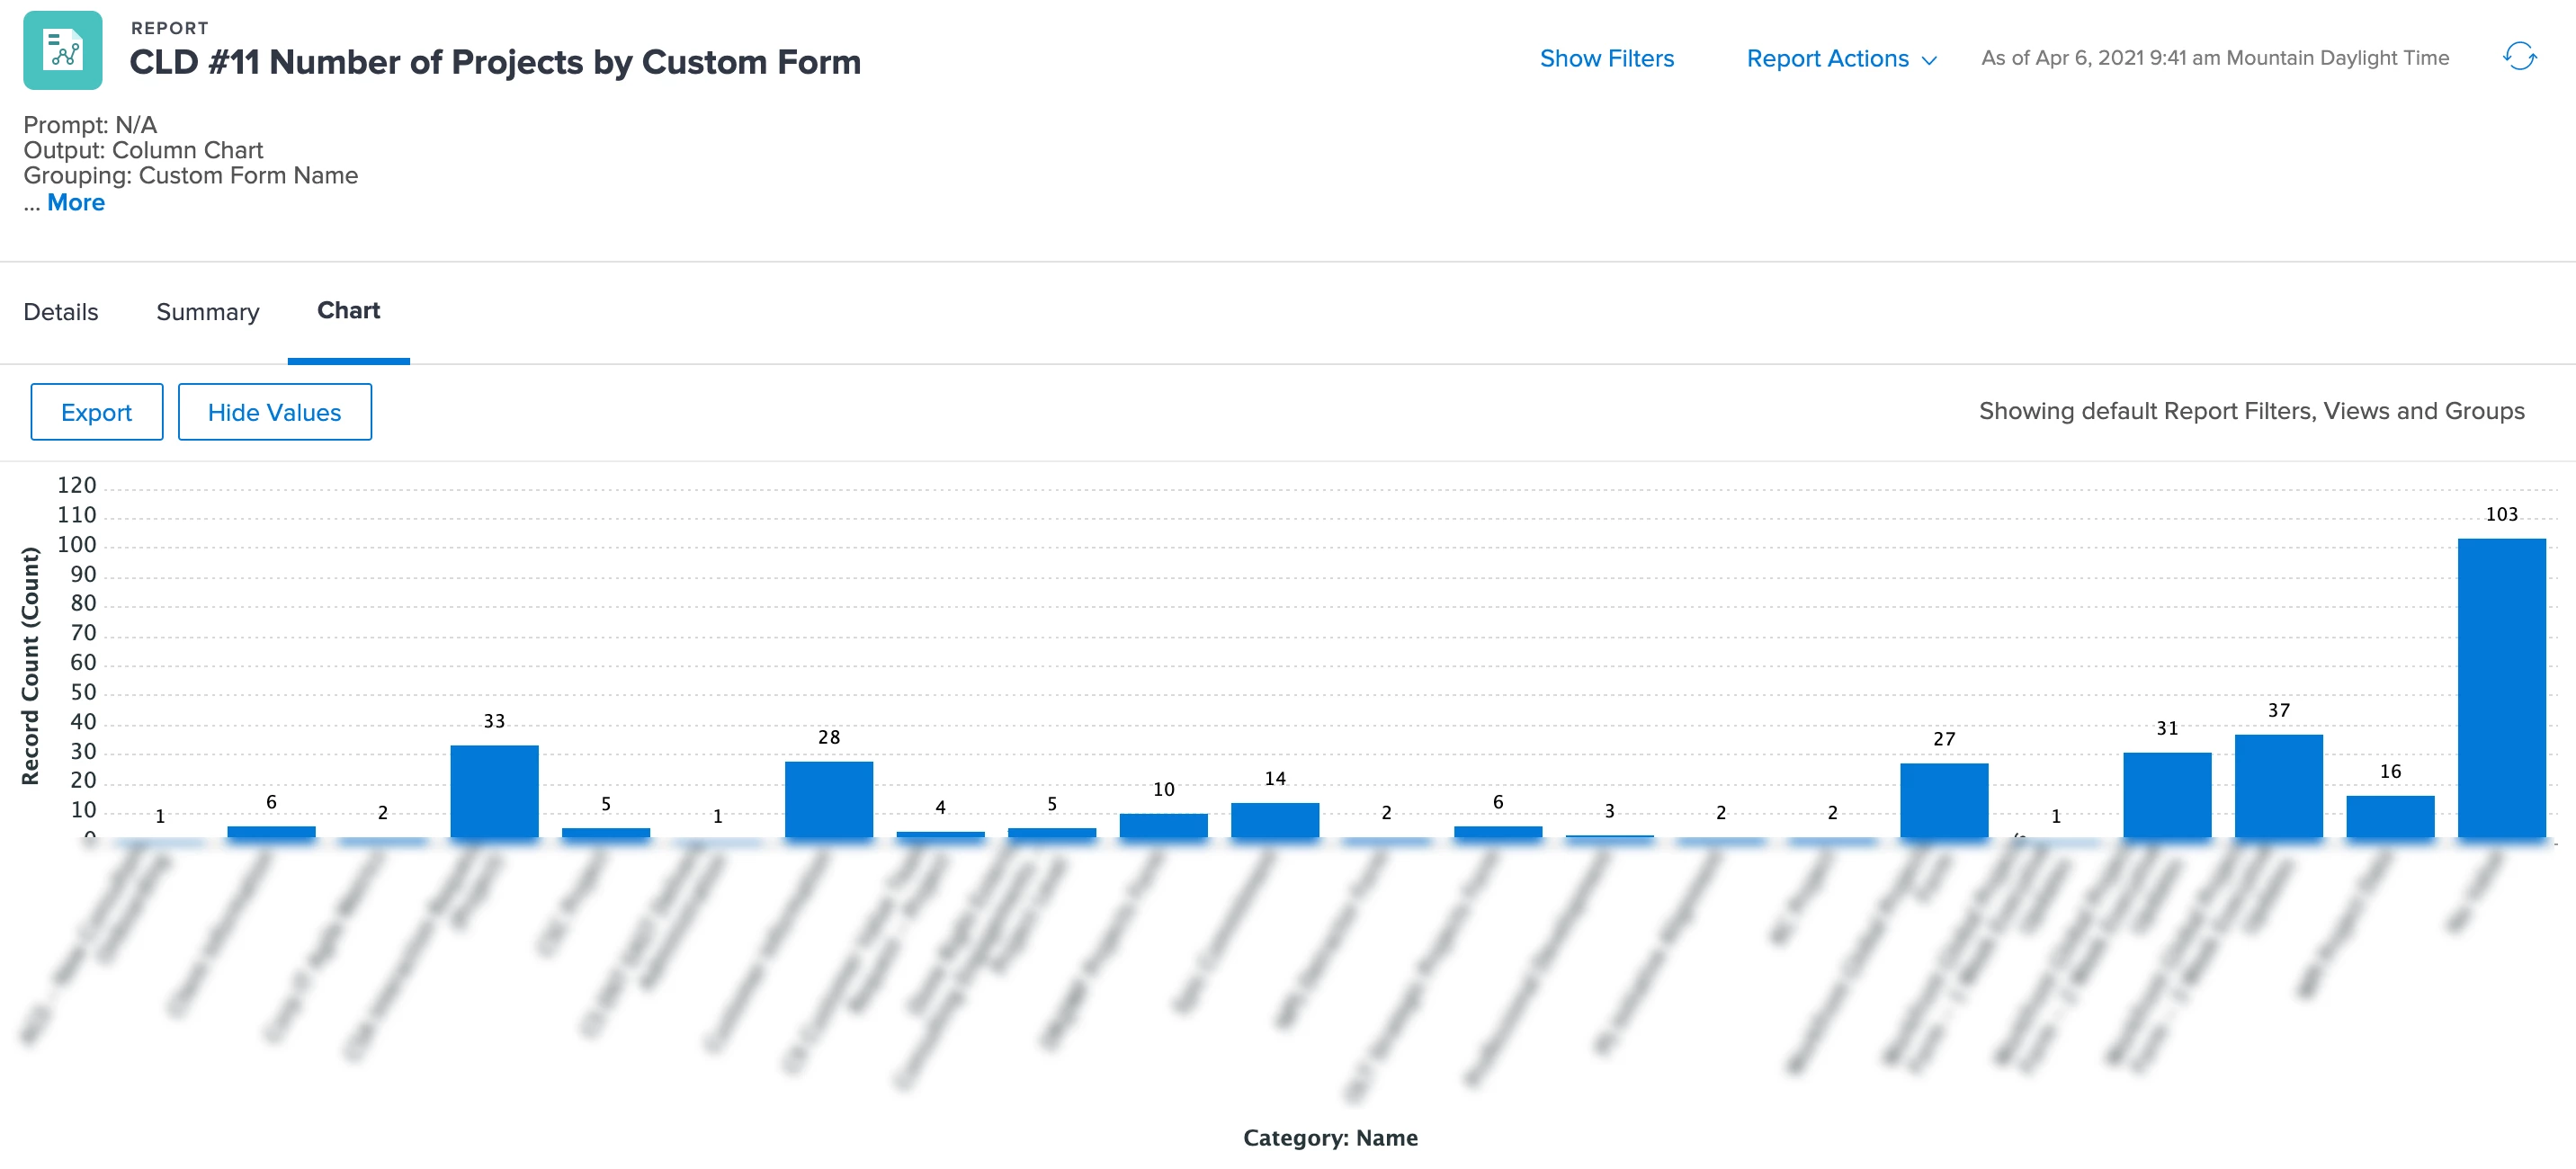
Number of Projects by Custom Form
- Project Report
- Filtered By
- Owner Home Group ID in (Home Group IDs)
- Prompt: N/A
- Output: Column Chart
- Grouping: Category Name
- Column Fields: Name, Owner, Description, Due On, % Complete, Template Name
- Summary: This displays how many projects have been created in the system, grouped by their Custom Form. This can be useful to determine projects with no custom forms or forms with low usage that could potentially be deleted or archived.
Tip: Projects can have multiple custom forms attached. Groupings will be based on the "First" custom form attached.
Template Audit
- Template Report
- Filtered By
- Owner Home Group ID in (Home Group ID)
- Prompt: N/A
- Output: List
- Grouping: N/A
- Column Fields: Name, Owner, Duration, Planned Hours, Custom Form, Milestone Path, Portfolio, Resource Managers, Resource Pools
- Summary: This report should highlight missing attributes on templates that enable a project manager to create templates faster. Attributes such as - Custom Form(s); Schedule; Resource Pool; Resource Manager(s); Document Folder Structure; Milestone Path; Project Approvals; etc.
Project Audit
- Project Report
- Filtered By
- Owner Home Group ID (Home Group IDs)
- Prompt: Entry Date
- Output: List
- Grouping: N/A
- Column Fields: Name, Owner, Start On, Due On, % Complete, Sponsor, Custom Form, Milestone Path, Portfolio, Resource Managers, Resource Pools
- Summary: This report will highlight missing attributes on templates that enable a project manager to create templates faster. Attributes such as - Custom Form(s); Resource Pool; Resource Manager(s); Milestone Path; etc.
Reports Audit
- Report Report
- Filtered By
- Entered By Home Group ID in Home Group IDs
- Grouping: Entered By Name
- Column Fields: Name, Description, Type, Entered By, Last Viewed Date, Last Viewed By Name
Custom Forms Audit
- Category Report
- Filtered By
- Entered By Home Group ID in (Home Group IDs)
- Column Fields: Name, Description, Type, Entered By, Last Viewed Date, Last Updated By Name, Last Updated By Entry Date, Is Active
Portfolios
- Portfolio Report
- Owner Home Group ID in (Home Group IDs)
- Output: Bar Chart
- Grouping: Owner Home Group ID, Owner Name
- Column Fields: Name, Description, Portfolio Manager
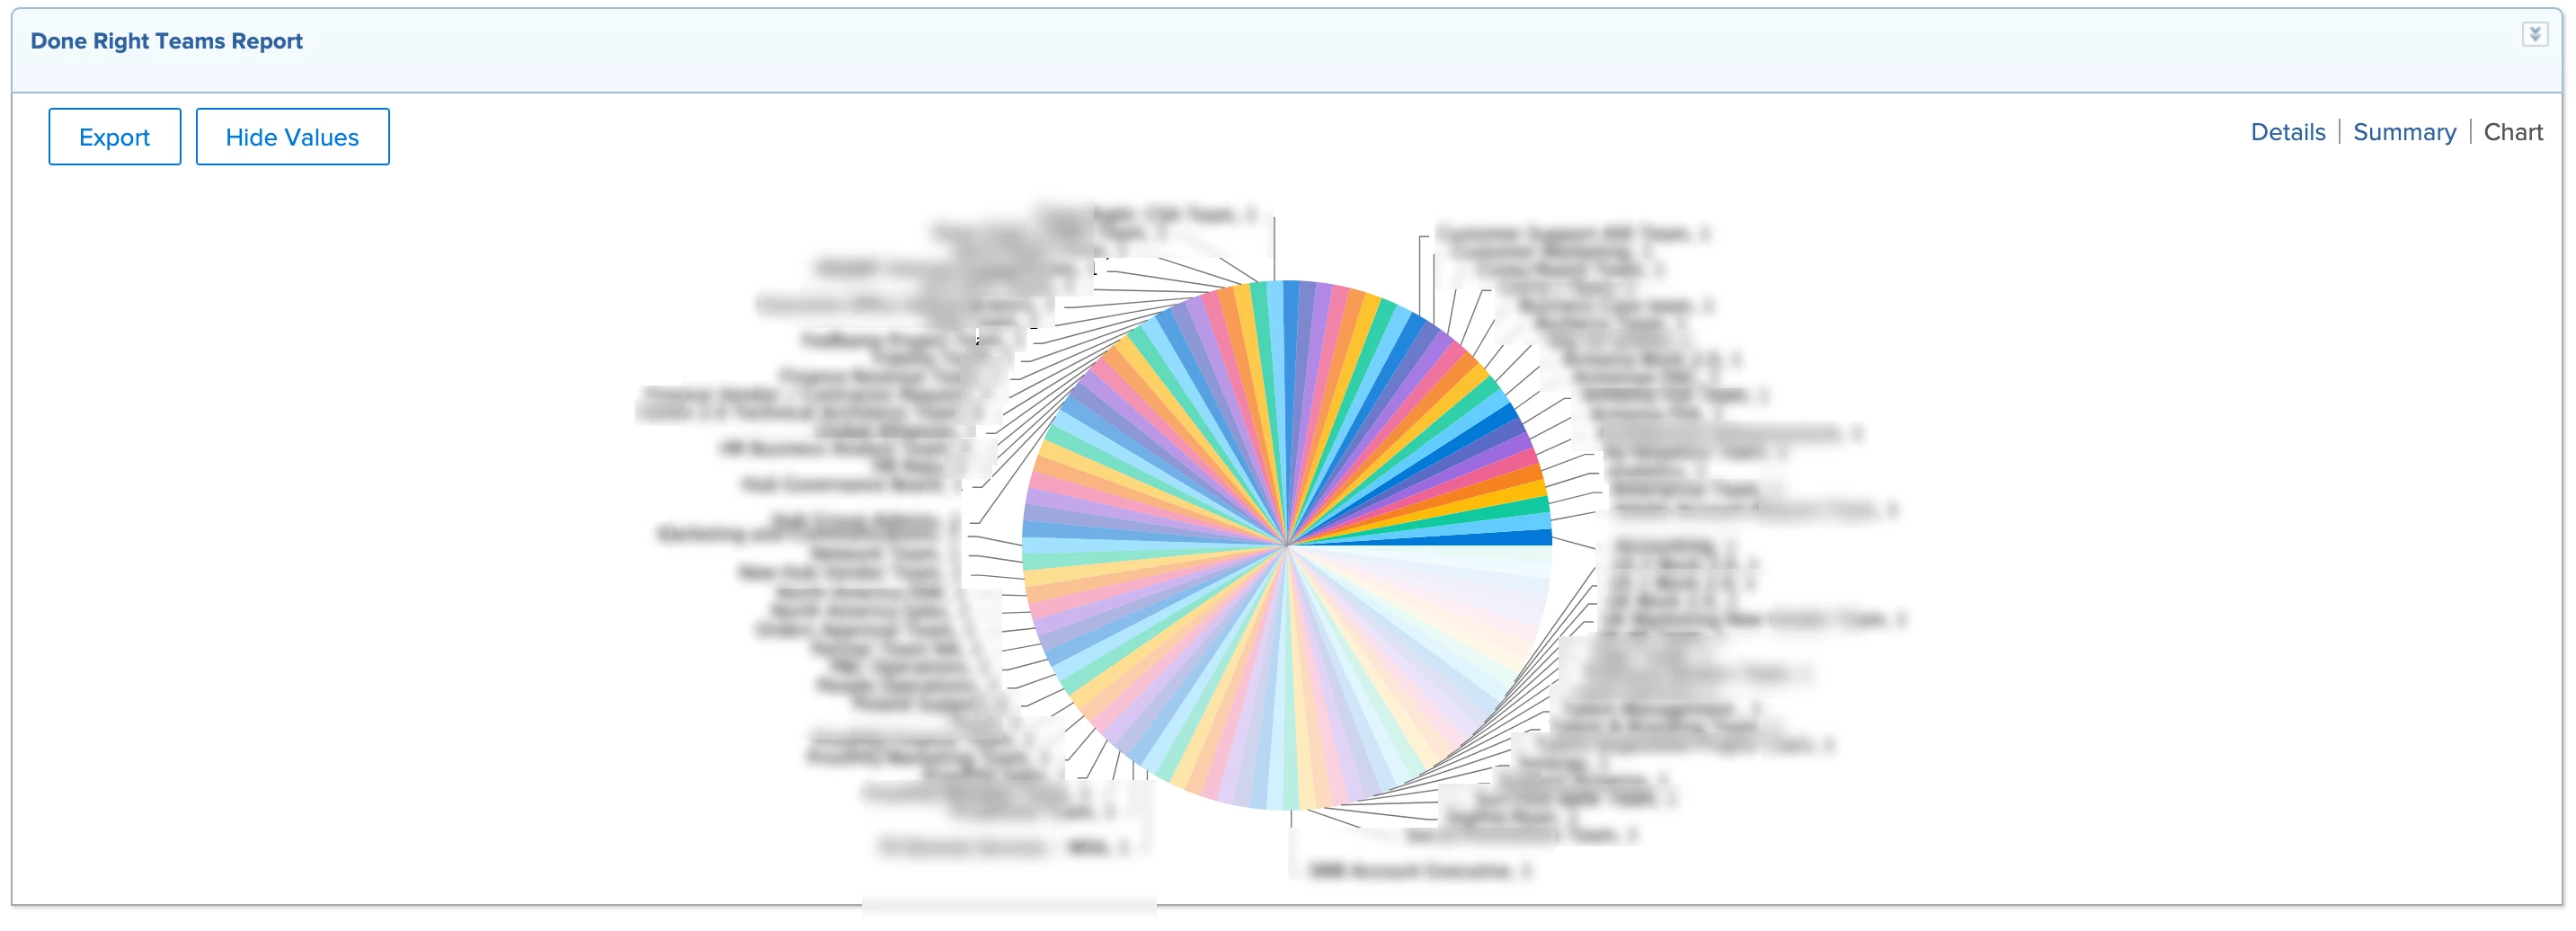
Teams
- Team Report
- Filtered By
- Owner Home Group ID in (Home Group IDs)=
- Output: Pie Chart
- Grouping: Team Name
- Column Fields: Name, Description
Departing Employee Dashboard
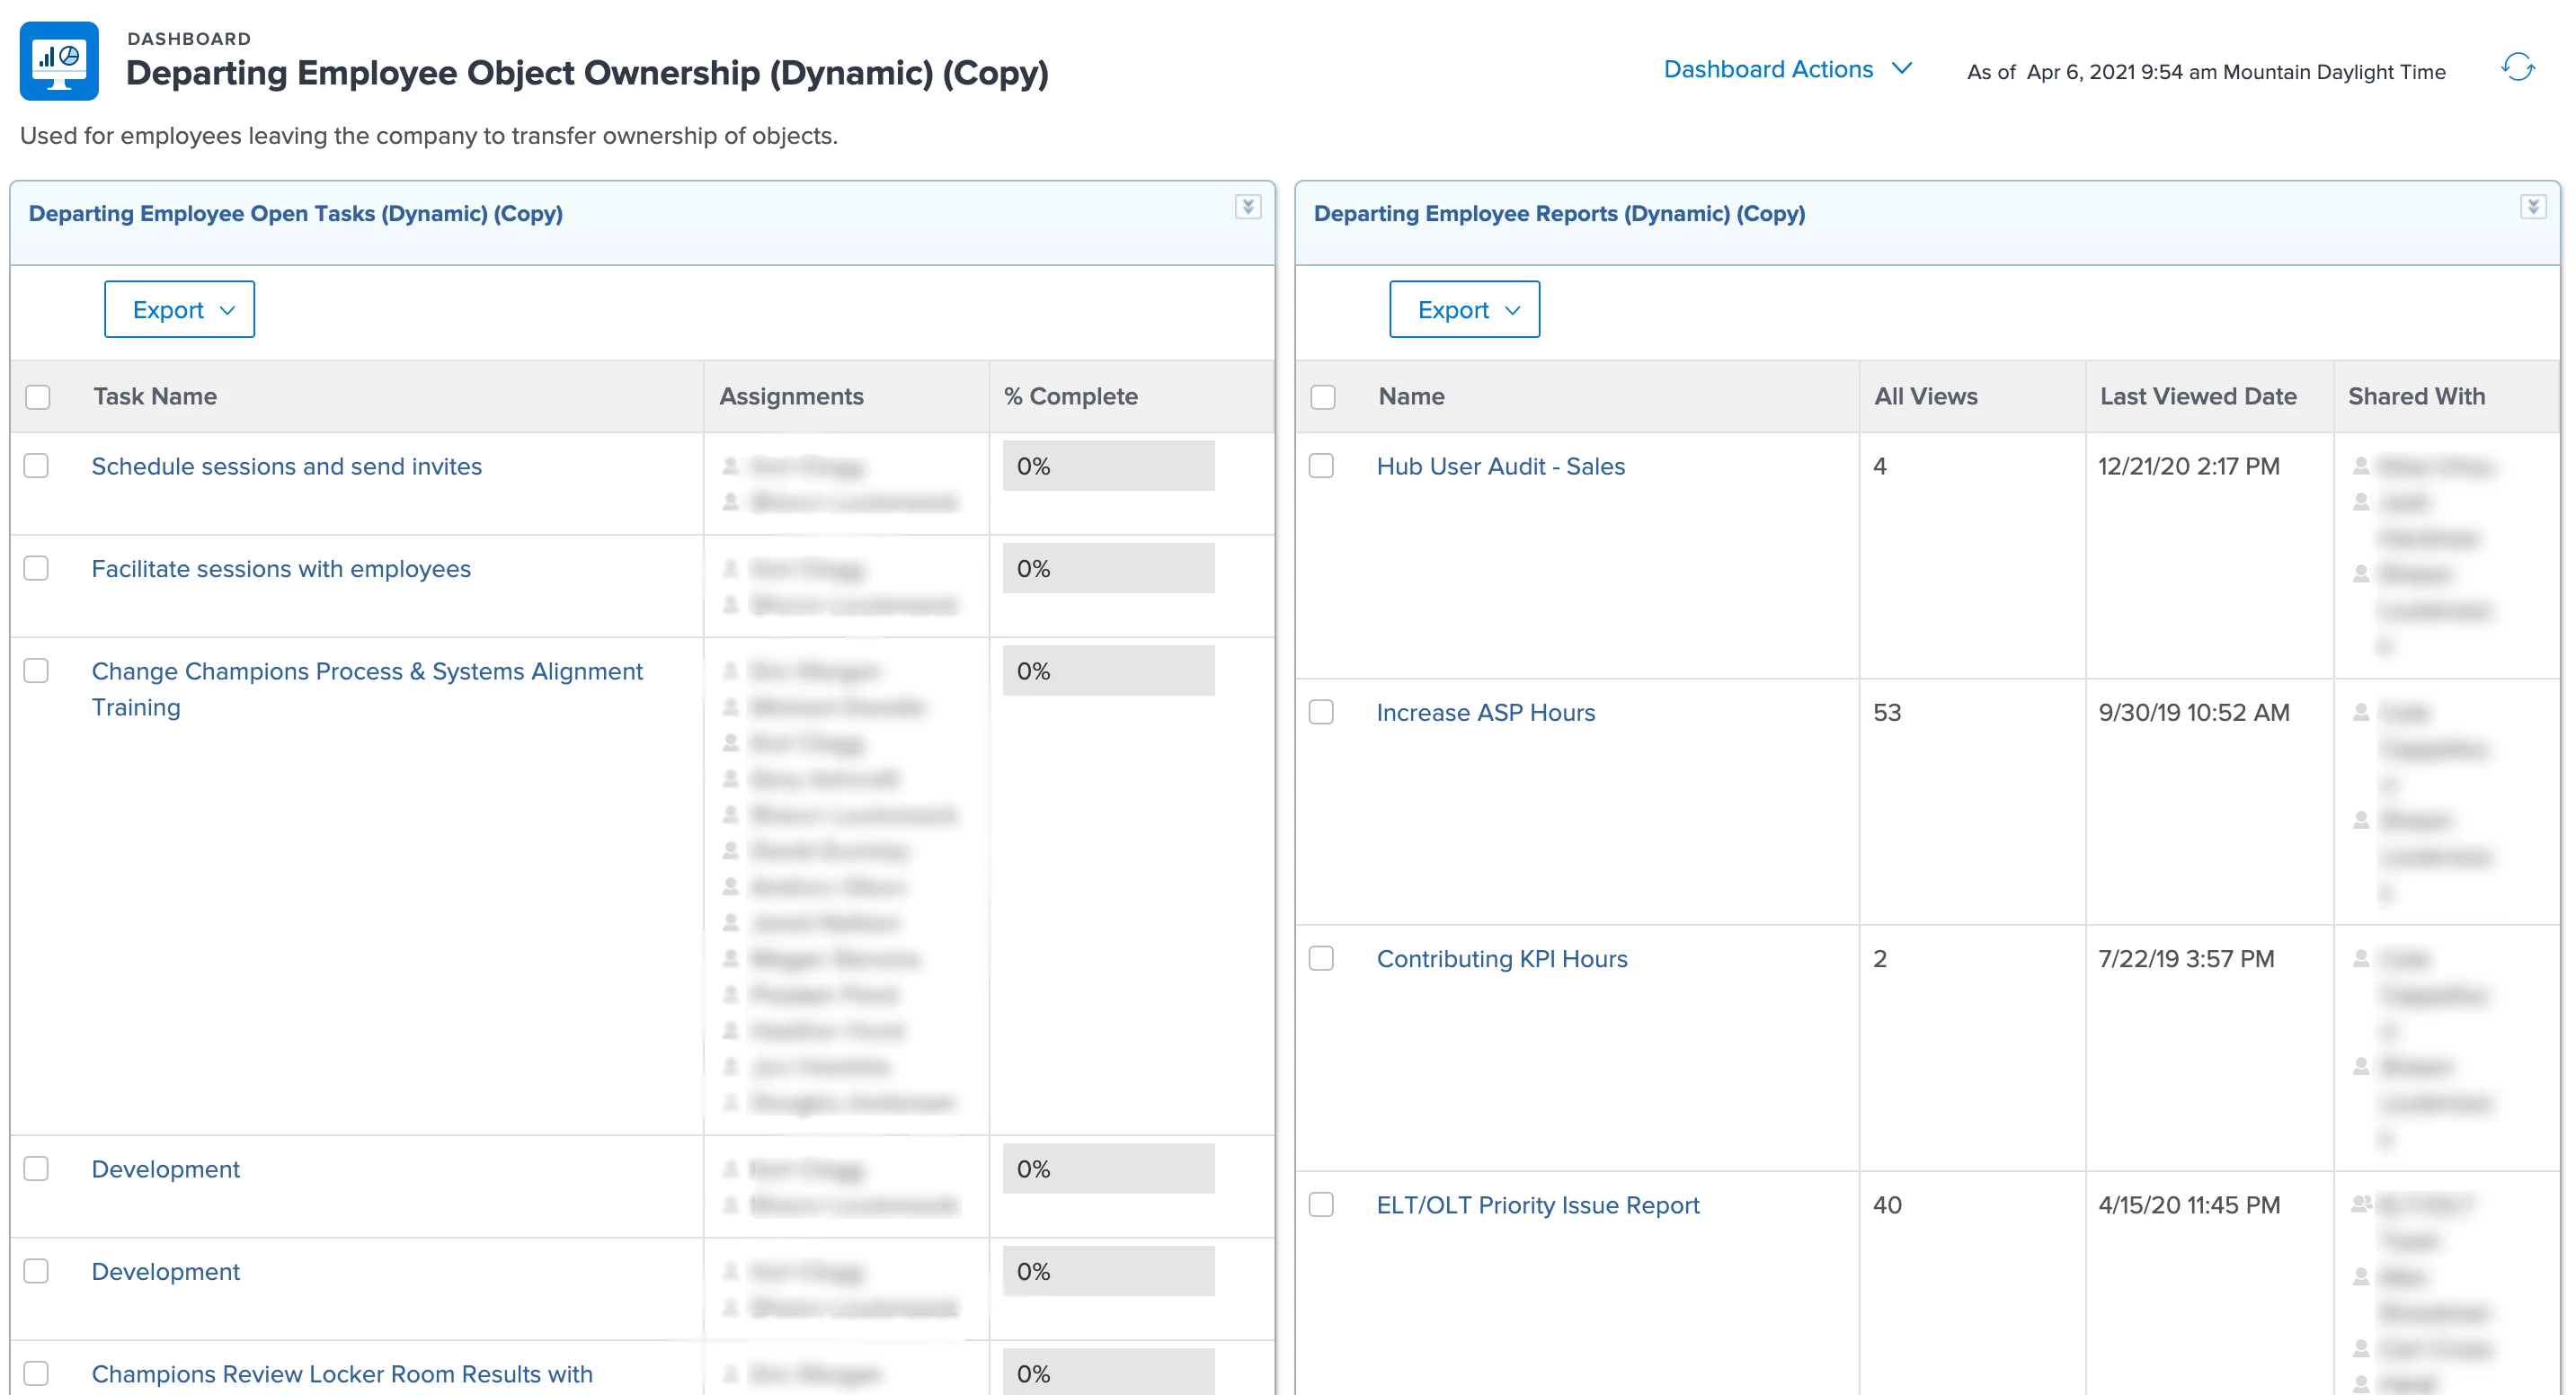
Departing Employee Open Tasks
- Task Report
- Filtered By
- Percent Complete less than 100
- and Status not in Cancelled, Closed, Complete, Deployed, Done
- Prompts Selected
- Assigned To ID in (Employee ID)
- and Assigned To ID any
Departing Employee Reports
- Report Report
- Prompts Selected
- Entered By ID in (Employee ID)
- and Entered By Name any
Departing Employee Open Issues
- Issue Report
- Filtered By
- Percent Complete less than 100
- and Status not in , Closed, Done, Resolved, Cancelled
- Prompts Selected
- Assigned to ID
Departing Employee Programs
- Program Report
- Filtered By
- Is Active equal (case sensitive) true
- Prompts Selected
- Owner ID in (Employee ID)
- and Owner Name any
Departing Employee Portfolios
- Portfolio Report
- Filtered By
- Is Active equal (case sensitive) true
- Prompts Selected
- Owner ID in (Employee ID)
- and Owner Name any
Departing Employee Projects
- Project Report
- Filtered By
- Status not in Cancelled, Complete, Dead
- Prompts Selected
- Owner ID in (Employee ID)
Departing Employee Owned Templates
- Template Report
- Prompts Selected
- Owner ID in (Employee ID)
- and Owner Name any
Departing Employee Owned Documents
- Document Report
- Prompts Selected
- Owner ID in (Employee ID)
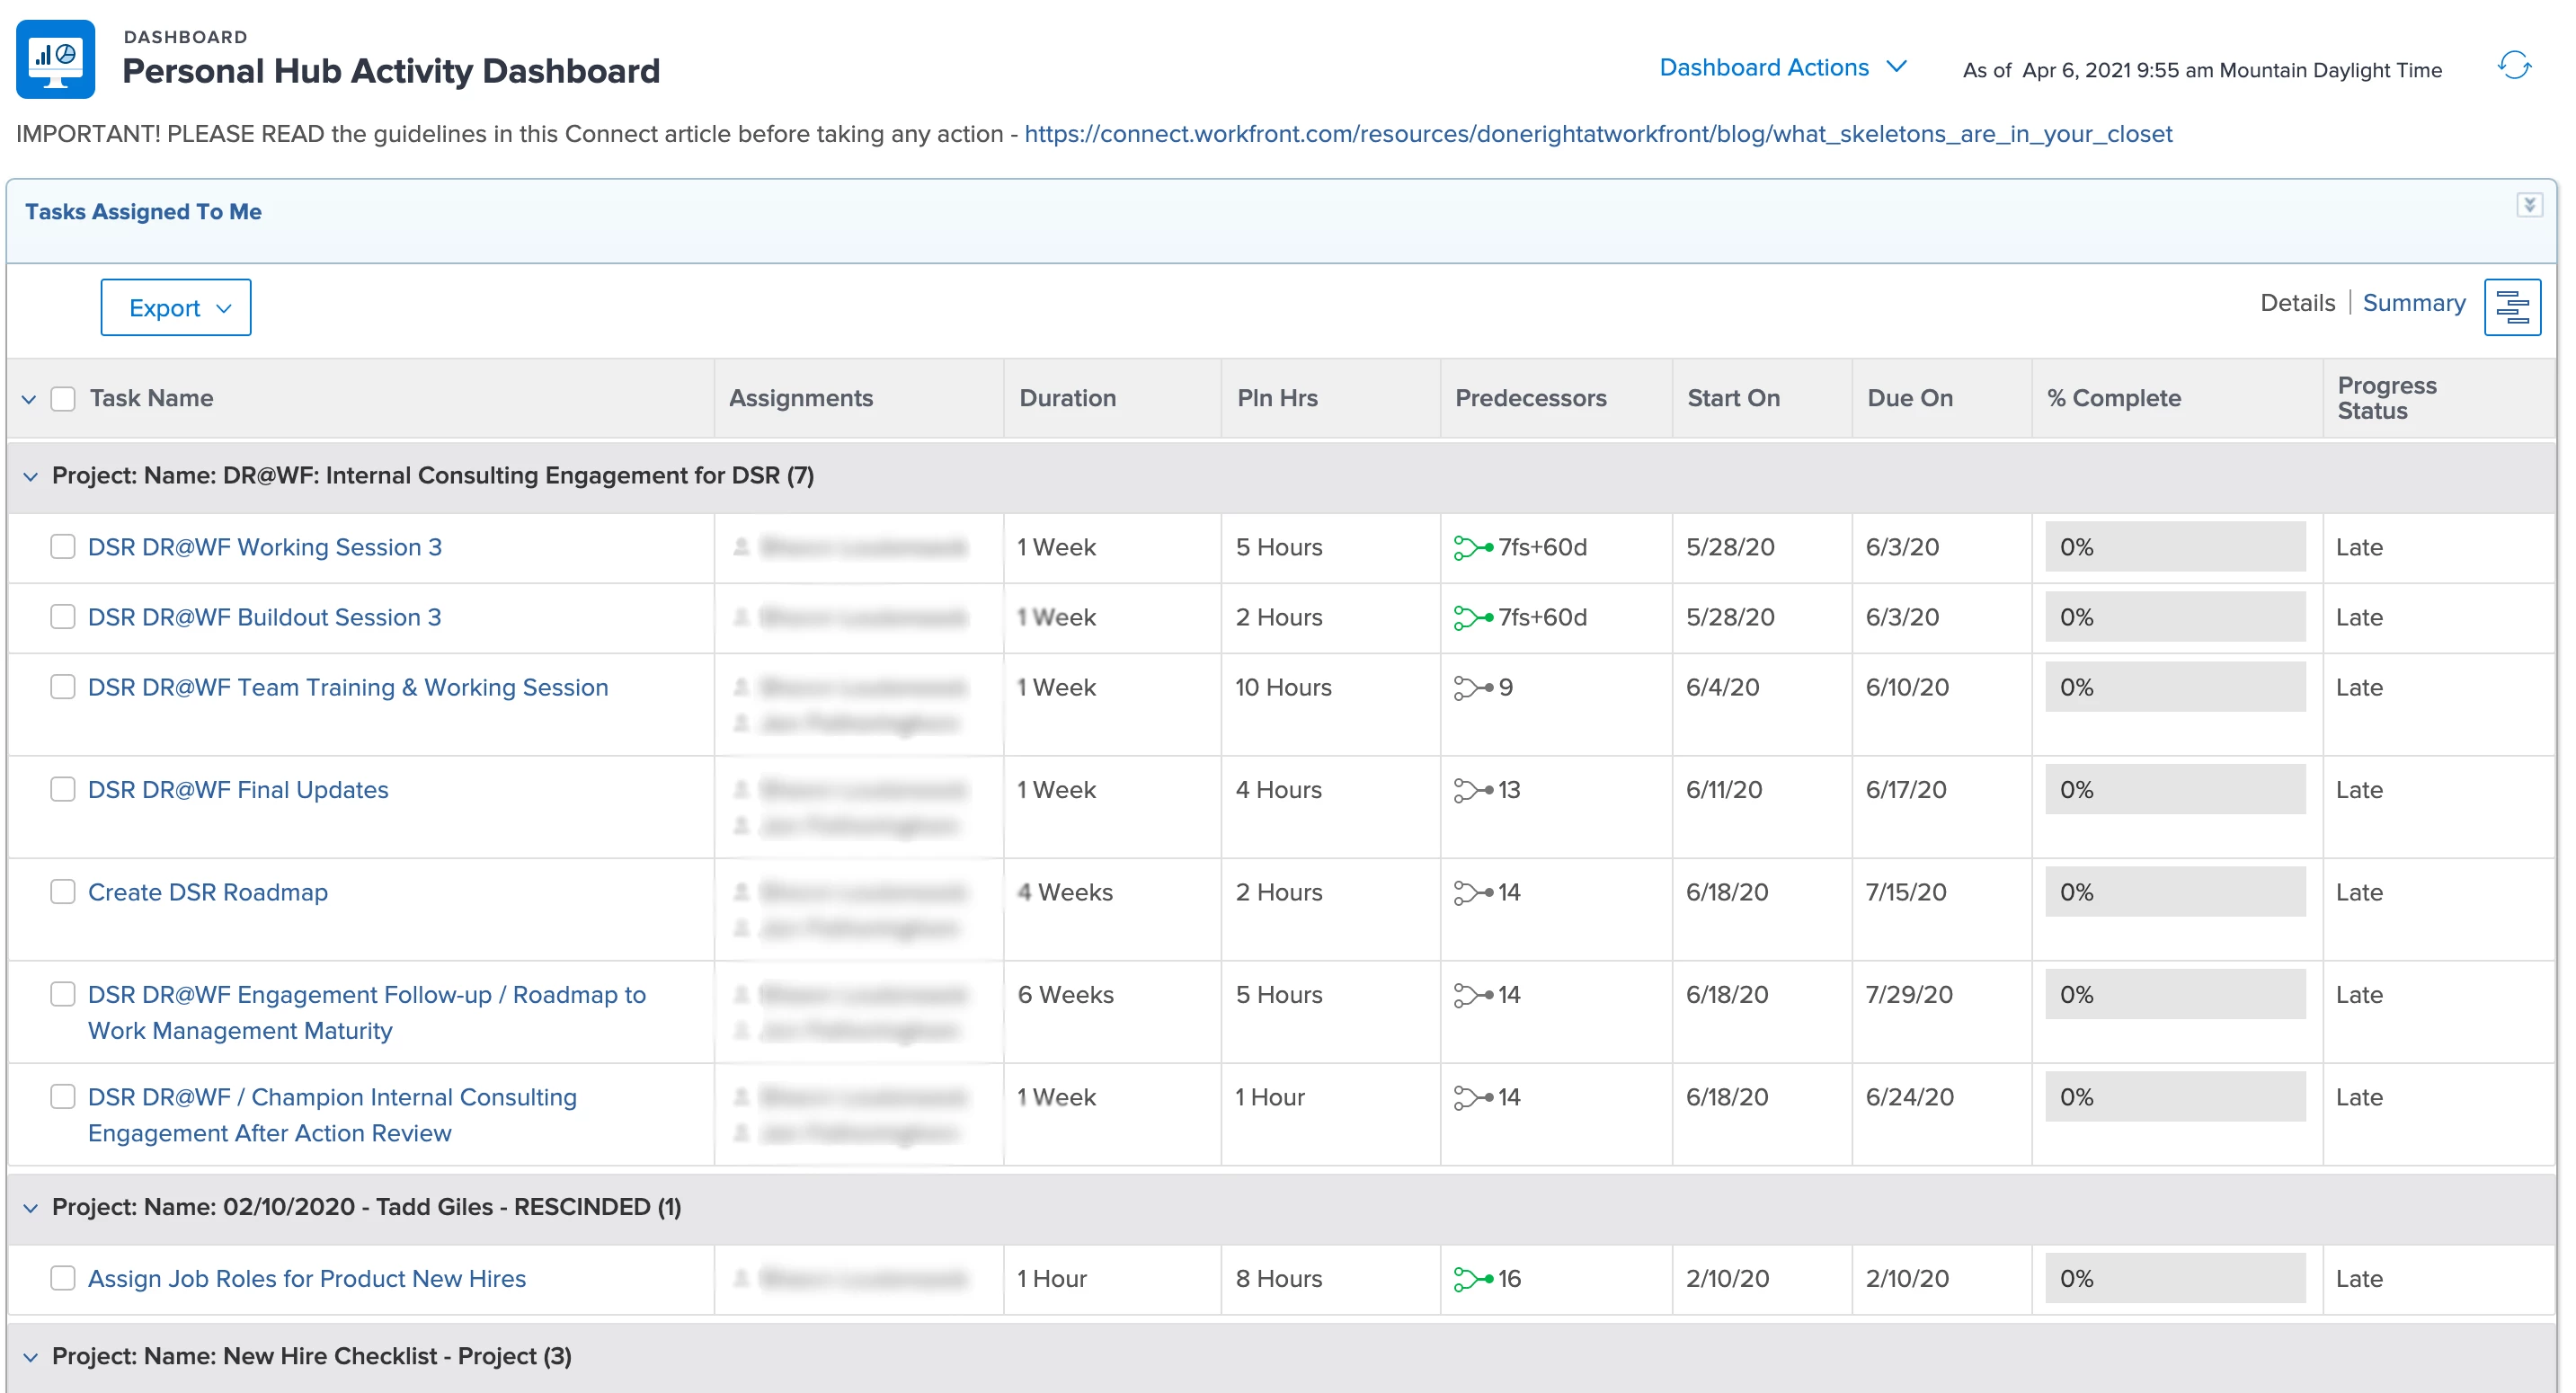
Personal Activity Dashboard
The personal activity dashboard is designed to show your teams a) all the active work they have in Workfront, and b) items they should probably mark as dead/cancelled/on hold or delete.
We created an article on our intranet with these warnings and placed this message in the description (at the top) of the dashboard:
IMPORTANT! PLEASE READ the guidelines in this article before taking any action - (link to intranet article)
Intranet Article
As part of the DR@WF initiative, we created a report for you to a) see everything you have going on in Hub, and b) delete what shouldn’t be there.
BUT BEFORE YOU DO, please keep this in mind:
Hub is Workfront’s OSR - Operational System of Record. If you delete something just because it’s old, you delete that record.
Don'ts / Strong Cautions
- DO NOT DELETE projects, tasks, issues, etc., that represent real, historical work.
- BE VERY CAREFUL when you consider deleting portfolios and programs. There may be projects and requests queues you cannot see based on your access level. Always check with your group administrator before deleting portfolios and programs.
- ALSO BE CAREFUL when deleting reports and dashboards. Look at the last viewed date. If it’s actively being used, but you should no longer own it, transfer ownership to the right person.
- FYI - If you make a mistake, these are the only objects that can be recovered in the Recycle Bin within 30 days: projects, tasks, issues, documents, templates. (Template tasks cannot be recovered.)
Dos / Tips
- Feel free to delete EMPTY, UNTITLED or TEST projects, tasks, issues, etc.
- Best practice is to mark as cancelled/dead/on hold 1 year+ projects, tasks and issues that are not complete and no longer relevant.
- The reports will only show you the first 15 or so results (15 of 237). Look in the bottom right-hand corner to ensure you’re seeing all the results.
- If the reports are collapsed, click on the top > sign to open up the results.
Now that you’ve been warned in ALL CAPS, here is the dashboard:
Personal Activity Dashboard (hyperlink to the dashboard in your instance)
You may want to favorite and/or pin this page in the New Workfront Experience.
Enjoy!
Personal Activity Dashboard Reports
Tasks Assigned to Me
- Task Report
- Filtered By
- Assigned To ID in $$USER.ID
- and Percent Complete less than 100
- and Status not in Cancelled, Closed, Complete, Deployed, Done
- Grouping: Project Name
- Column Fields: Task Name, Assignments, Duration, Planned Hours, Predecessors, Start On, Due On, % Complete, Progress Status
Issues I Own
- issue Report
- Filtered By
- Assigned To ID in $$USER.ID
- and Percent Complete less than 100
- and Status not in Closed, Done, Resolved, Cancelled
- Grouping: Project Name
- Column Fields: Project Name, Assignments, Priority, Status, Logged, Completed
Projects I Own
- Project Report
- Filtered By
- Owner ID equals $$USER.ID
- and Status not in Cancelled, Complete, Dead
- Column Fields: Name, Owner, Start On, Due On, % Complete, Status
Number Of Projects By Template I Own
- Project Report
- Filtered By
- Template Owner ID equals $$USER.ID
- Prompt: N/A
- Output: Column Chart
- Grouping: Template Name
- Column Fields: Name, Owner, Description, Due On, % Complete, Template Name
- Summary: Display how many projects have been created in the system, grouped by their Template. This can be useful to determine the projects with no template or templates with low usage that could potentially be deleted or archived. Projects in the “No Value” column were created without using a template which may present a governance problem.
Templates I Own (Reference the Above Report)
- Template Report
- Filtered By
- Owner ID in $$USER.ID
- Column Fields: Name, Owner, Duration, Planned Hours, Date Late Updated, Last Updated By: Name, Shared With
Programs I Own
- Program Report
- Filtered By
- Is Active equal (case sensitive) true
- and Owner ID in $$USER.ID
Portfolios I Own
- Portfolio Report
- Filtered By
- Is Active equal (case sensitive) true
- and Owner ID in $$USER.ID'
- Column Fields: Name, Description, Portfolio Manager, Shared With
Reports I Own
- Report Report
- Filtered By
- Entered By ID in $$USER.ID
- Column Fields: Name, Type, Entered By, Shared With, Last Viewed By: Name, Last Viewed Date
Dashboards I Own
- Dashboard Report
- Filtered By
- User ID in $$USER.ID
- Column Fields: Name, Owner, Shared With, Last Update Date