Expand my Community achievements bar.

SOLVED

How to use Experience Platform Debugger as a replacement for Omnibug?

Avatar

Level 2

Hi community! 

I have worked for a while doing page tag and link click/interaction tag QA using Omnibug, which is helpful for making sure the right v55, v29, etc. values are firing prior to site deployments. However, our company recently switch to the WebSDK which seems to make Omnibug unusable for these types of QA tasks.

Our tech team seemed to indicate that this was an expected result but that we should be able to use the Adobe Experience Platform Debugger to perform similar QA tasks. However, I am struggling to find where these types of values (v55, v29, etc.) are visible within the debugger as I click throughout our site now.

Based on some initial Googling and combing through official documentation, I have tried the following, but to no avail:

  • Made sure I was signed in within the Debugger to my Adobe account
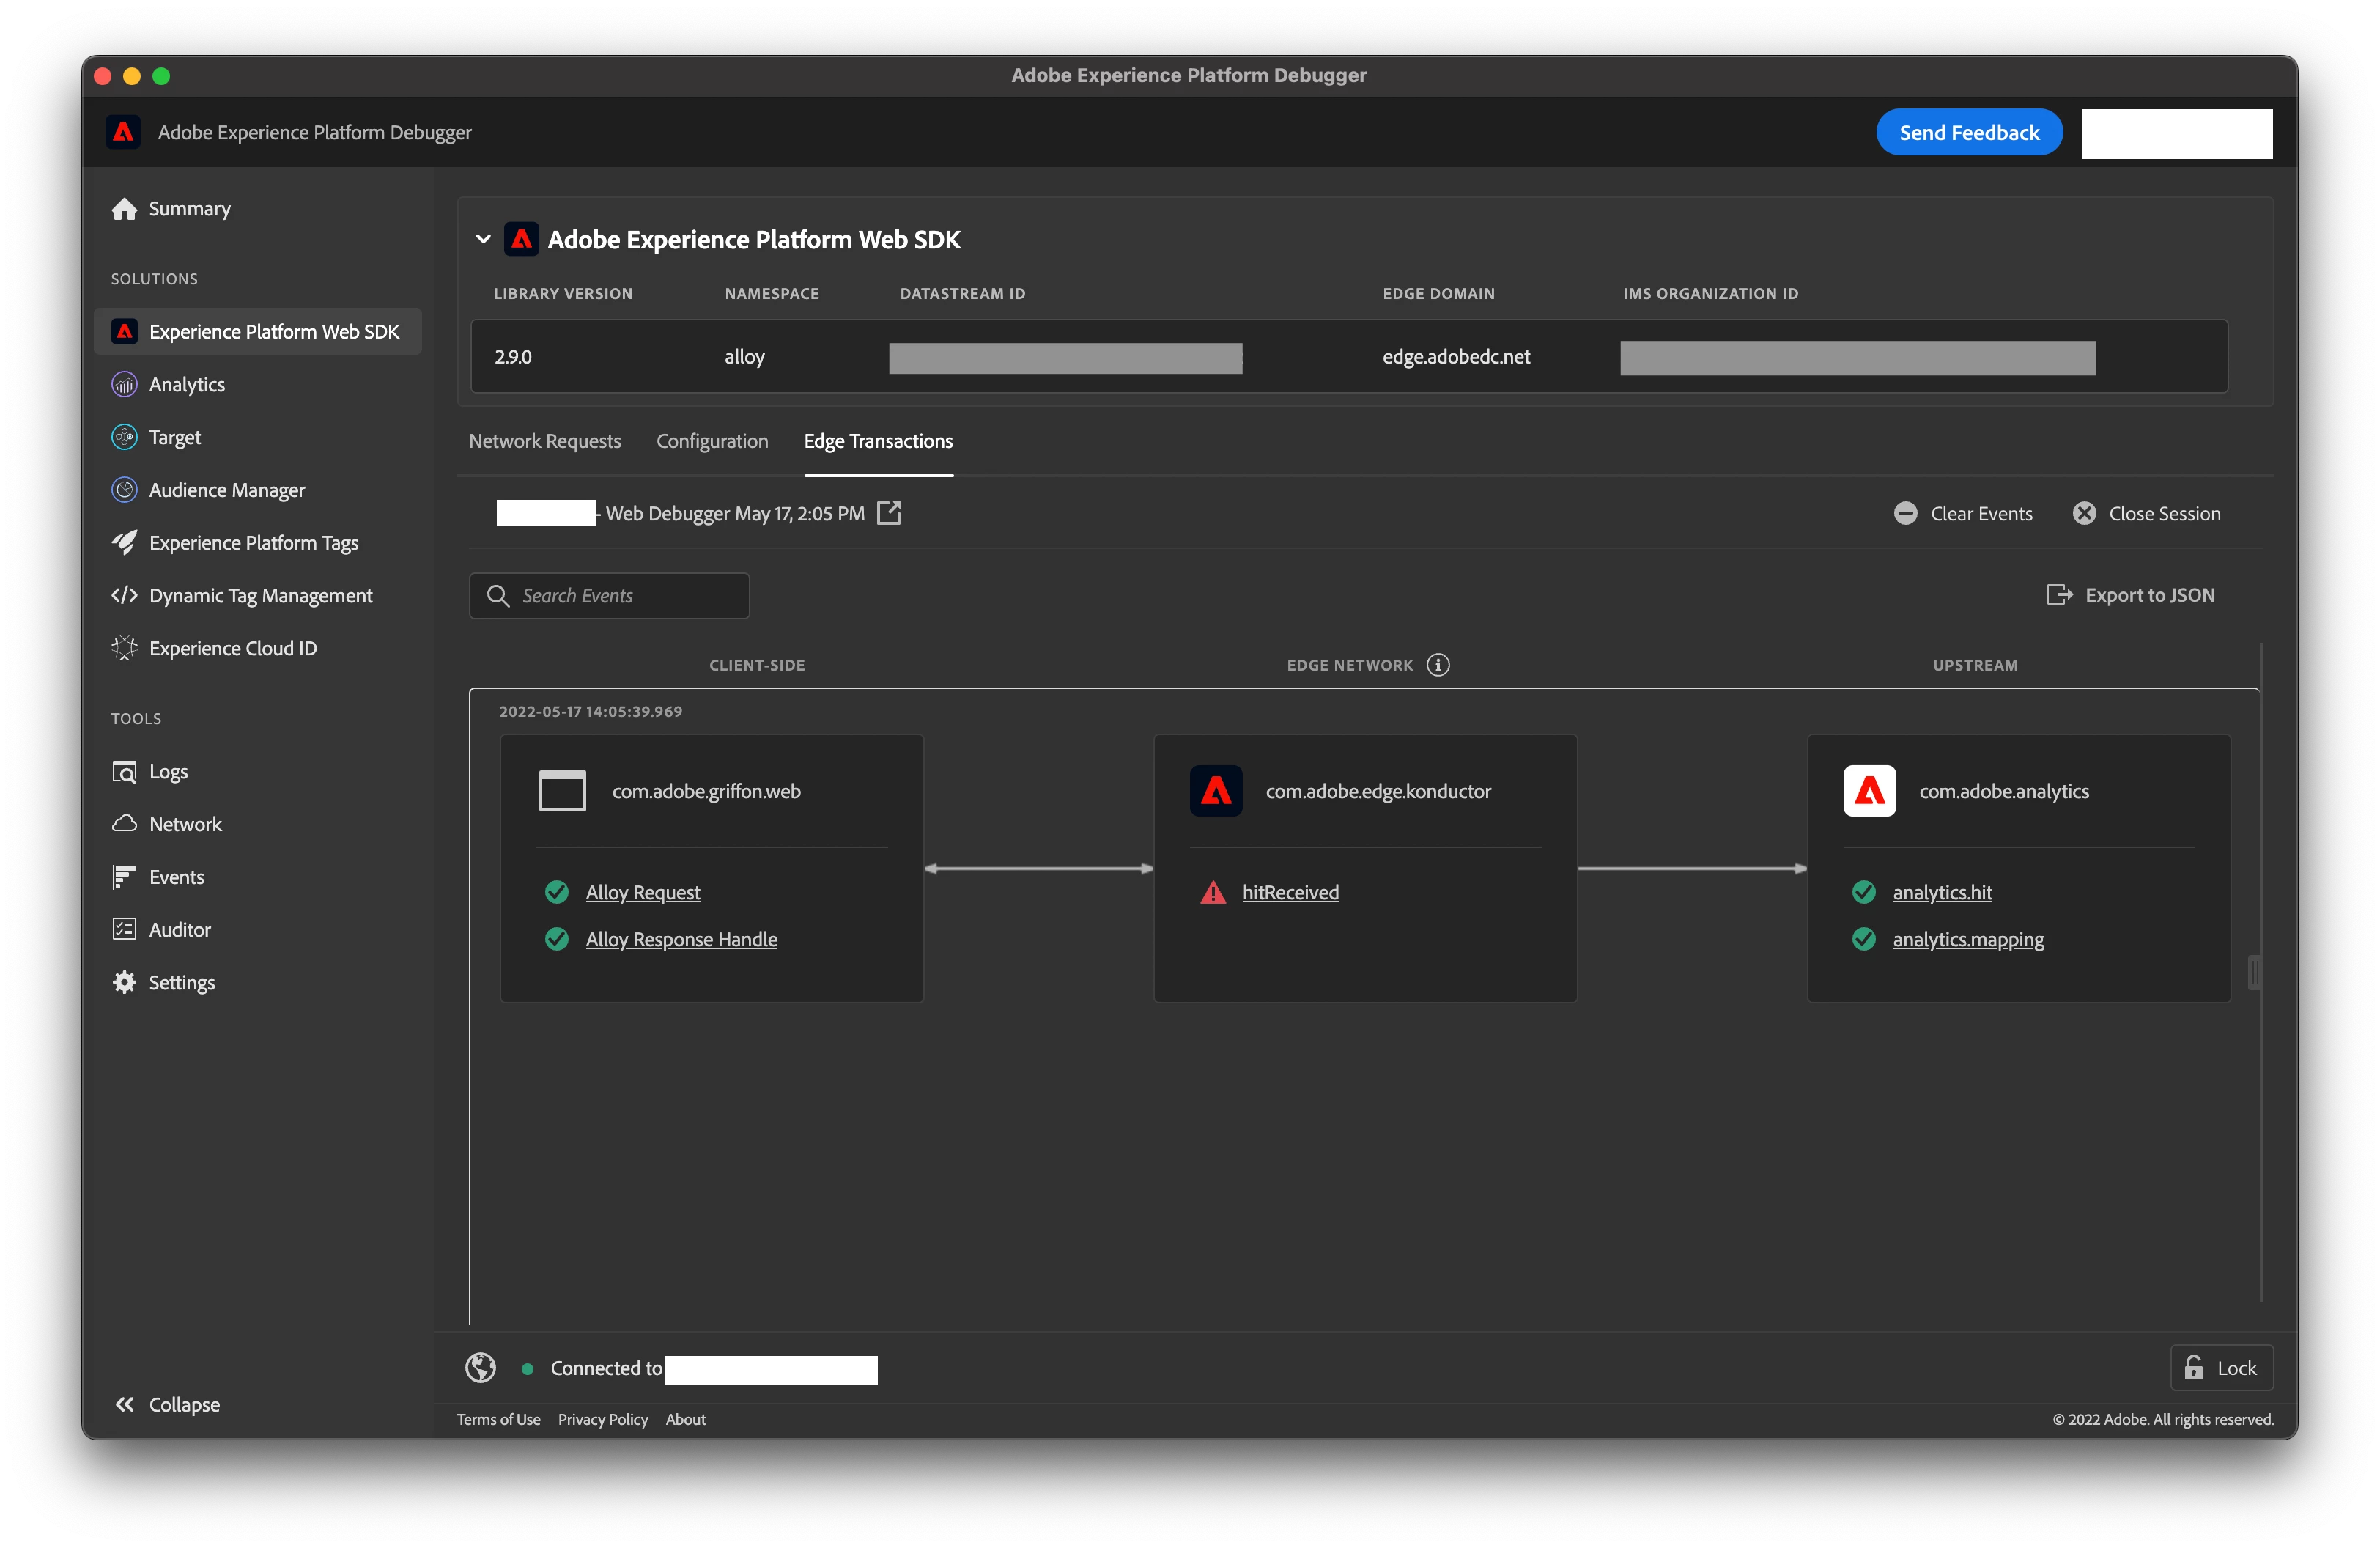
  • Turned on "Debug enabled" under WebSDK --> Configuration
  • Clicked "Connect" under WebSDK --> Edge Transactions
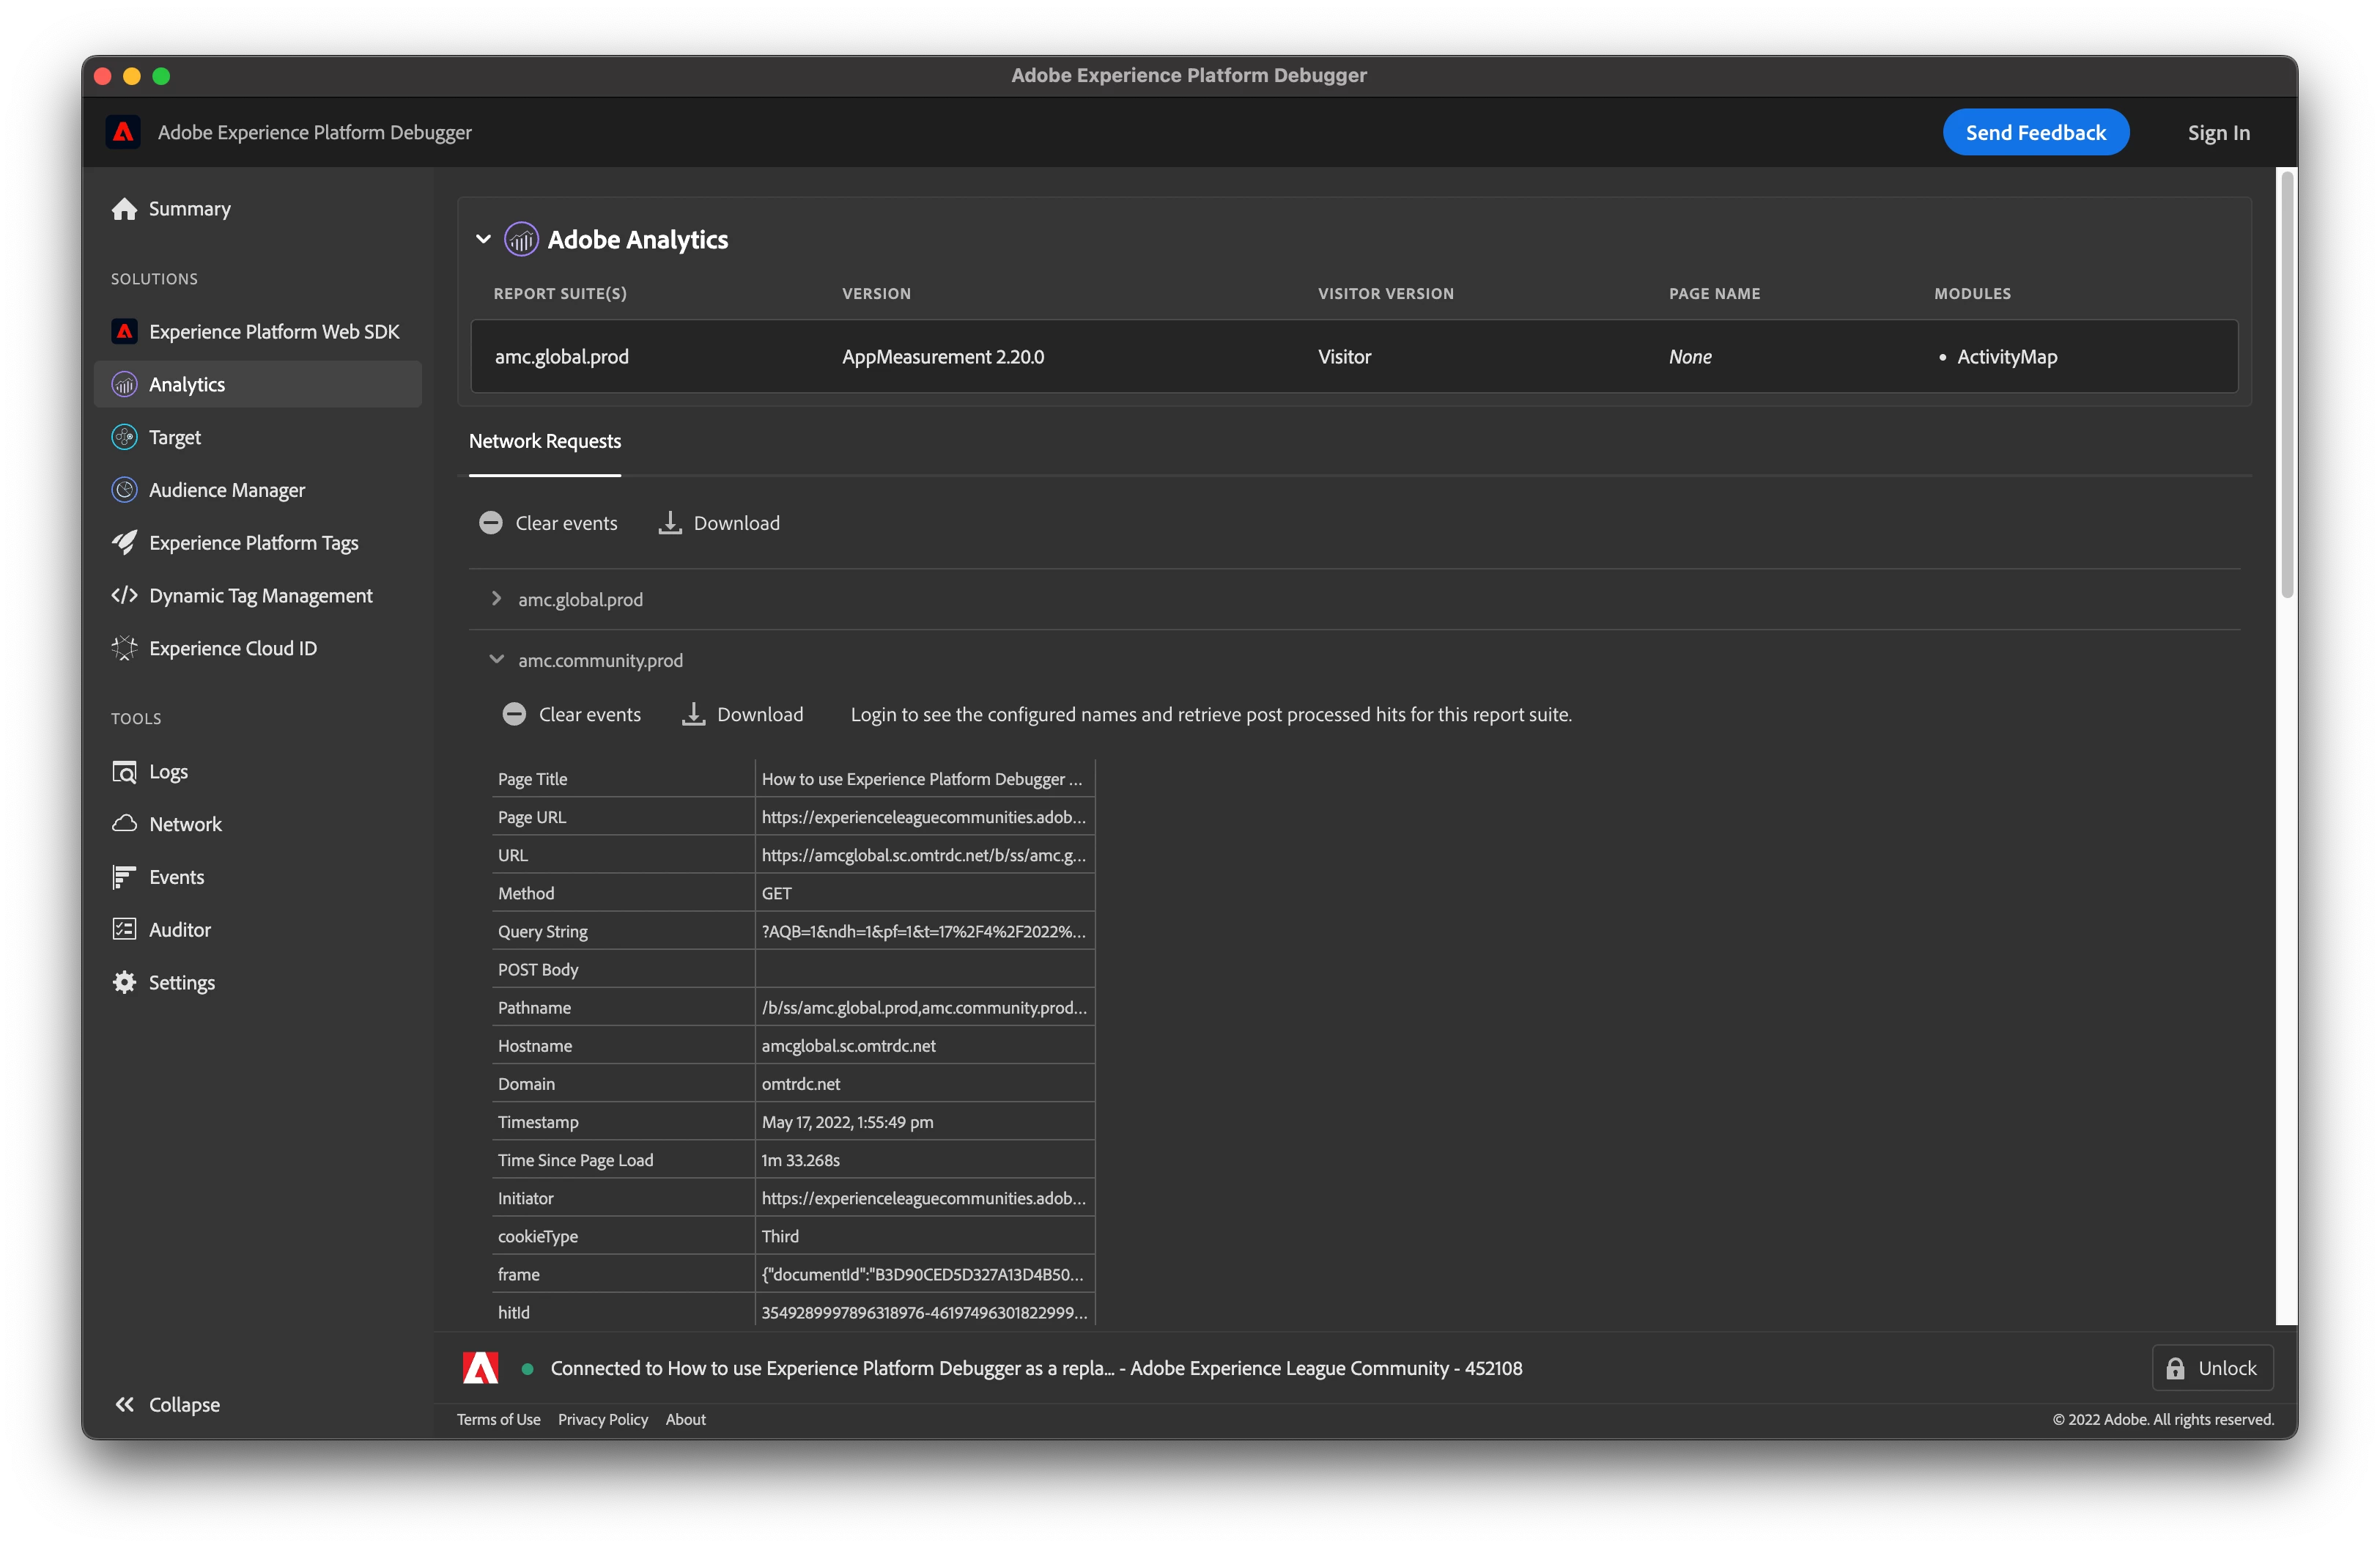
  • Looked under "Analytics", "Logs", "Network", "Events", etc. within the primary navigation of the Debugger
  • I am using a Windows 10 Enterprise laptop and have tried in both Chrome (I have adblocker extensions for Chrome, but they are turned off for our company's site) and Firefox (no ad blocker add-ons whatsoever) but neither browser seems to give me the data I am looking for

I can see some requests/etc. "fire", but not the values I am used to seeing from my Omnibug experience and which I need in order to QA tags (v55, v29, etc.). I can also see resulting data for these types of tags in Adobe Analytics, so I know that data is being passed, I just can't seem to find it for real-time QA purposes on our live site or staging, which would make me nervous about future deployments.

Am I missing something basic here? 

Thanks! Appreciate any direction the community might have.

1 Accepted Solution

Avatar

Correct answer by
Community Advisor

Hi @jgibbons6031,

You need to get clear if you are using the newer Web SDK or Adobe Analytics, their data appear in different tabs in the AEP Debugger.

For example, the following is the Adobe Analytics data of this particular page now. Adobe is using the old Adobe Analytics for tracking and they don't send any evar at all but context data only.

Screenshot 2022-05-17 at 1.59.02 PM.png


However, if you are using the newer AEP Web SDK, https://experienceleague.adobe.com/docs/experience-platform/edge/home.html?lang=en, you can check for 'Experience Platform Web SDK' on the left menu. From there you can click on the 'analytics.hit' to find what data was sent to Adobe Analytics.

Screenshot 2022-05-17 at 2.05.48 PM.png


Even better and my current preference for AEP Web SDK is using the Project Griffon, which can be accessed from 'Web Debbuger May 17, 2:05PM' on the above screen. It provides the same content and even more data validation functions in a bigger and familiar browser window.

View solution in original post

2 Replies

Avatar

Correct answer by
Community Advisor

Hi @jgibbons6031,

You need to get clear if you are using the newer Web SDK or Adobe Analytics, their data appear in different tabs in the AEP Debugger.

For example, the following is the Adobe Analytics data of this particular page now. Adobe is using the old Adobe Analytics for tracking and they don't send any evar at all but context data only.

Screenshot 2022-05-17 at 1.59.02 PM.png


However, if you are using the newer AEP Web SDK, https://experienceleague.adobe.com/docs/experience-platform/edge/home.html?lang=en, you can check for 'Experience Platform Web SDK' on the left menu. From there you can click on the 'analytics.hit' to find what data was sent to Adobe Analytics.

Screenshot 2022-05-17 at 2.05.48 PM.png


Even better and my current preference for AEP Web SDK is using the Project Griffon, which can be accessed from 'Web Debbuger May 17, 2:05PM' on the above screen. It provides the same content and even more data validation functions in a bigger and familiar browser window.

Avatar

Level 2

Thanks @leocwlau after some digging against both the analytics.hit and Griffon sections, I think I am seeing the values I was looking for. Appreciate the assistance!