Hi, I am working on a project in which the front end is Angular. I am trying to set up a debugger to check the values in the sling model on runtime. But my debugger is not stopping at the breakpoints. however, I am connected to the socket. below is my configuration.
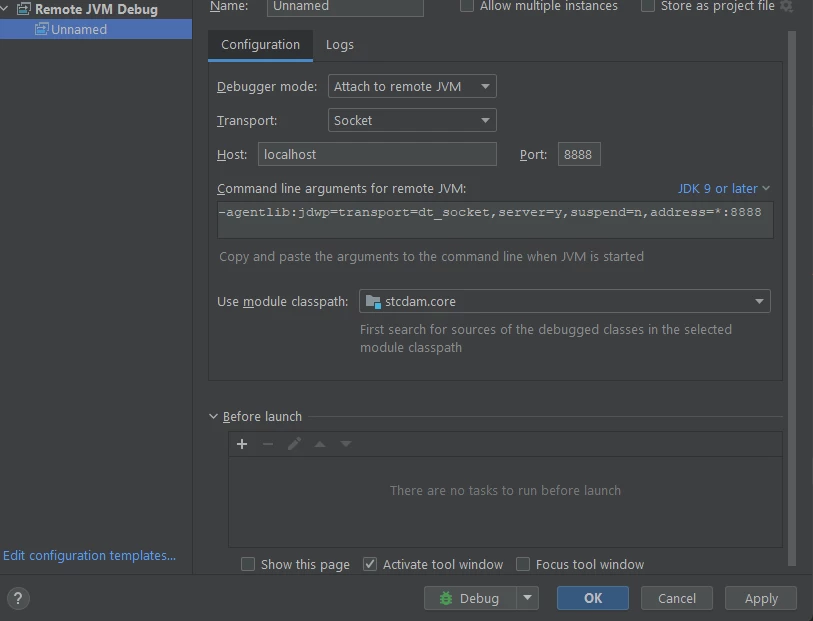
Solved! Go to Solution.
Topics help categorize Community content and increase your ability to discover relevant content.
Views
Replies
Total Likes
If you have started your AEM using the standard debugging options i.e.
-Djava.awt.headless=true -agentlib:jdwp=transport=dt_socket,address=30303,server=y,suspend=n
then change the JDK9 or later option to JDK 5-8 and it should work
Adjust the port as per your configuration.
Hi,
Please check this article: https://aemgeeks.com/aem-debugging/how-to-start-aem-in-debug-mode/
Things to double-check:
Ensure your AEM instance is running in debug mode.
Verify that the code deployed is the same as the code you are debugging. Sometimes, it is useful to redeploy the code to ensure it is up to date; otherwise, it may not work.
Hope this helps
I have done all the above and still cannot stop the debugger at breakpoints.
Try to remove all code from your instance, manually delete the code references via CRX/de, delete the packages installed in the package manager, and then redeploy your code. After completing these steps, make sure that your code functions correctly in the instance, that the bundle is active, and so on. Next, try enabling debug mode in IntelliJ.
If you have started your AEM using the standard debugging options i.e.
-Djava.awt.headless=true -agentlib:jdwp=transport=dt_socket,address=30303,server=y,suspend=n
then change the JDK9 or later option to JDK 5-8 and it should work
Adjust the port as per your configuration.
I fixed the issue not sure if that is the reason or not. I was running my instance on Powershell. But when I started the instance on cmd with run as admin. It worked.
Thanks for the reply
Views
Likes
Replies
Views
Like
Replies