Expand my Community achievements bar.

Webinar: Adobe Customer Journey Analytics Product Innovations: A Quarterly Overview. Come learn for the Adobe Analytics Product team who will be covering AJO reporting, Graph-based Stitching, guided analysis for CJA, and more!
SOLVED

Breakdown dimensions with multiple ItemIDs on Report API

Avatar

Level 1

I've been facing a performance issue when dealing with multiple dimensions (more than 2) on Reports API using Python (URI: analytics.adobe.io/api/xxxx/reports). I didn't find any example of this case, not even a topic in this community.

When I need to get all data for multiple dimensions, firstly I need to create all combinations (like a matrix) of each ItemID from a dimension "A" with each ItemID from a dimension "B" and "C" and so on. it causes a ton of combinations and a ton of API requests, and the majority of all requests doesn't brings back any result because, for example, not all "days" had the same "product" sold.


So, I wonder if someone knows a way to use multiple metricFilters for the same dimension in an unique API request.

Example:


{
    ...
    "metricContainer": {
        "metrics": [
            {
                "id": "metrics/orders",
                "filters": [ 0 ]
            }
        ],
        "metricFilters": [
            {
                "id": "0",
                "type": "breakdown",
                "dimension": "variables/product",
                "itemId": ["0000000001", "0000000002", "0000000003"]
            }
        ]
    },
    "dimension": "variables/campaign",
    ...
}
1 Accepted Solution

Avatar

Correct answer by
Community Advisor

I haven't used the API 2.0 much, but my understanding was that to "improve" performance, it didn't do complex breakdowns... hence the need to run multiple requests....


However, if you are trying to get a lot of breakdowns, it's not all that efficient... while not really recommended for new implementations, have you considered using the old API 1.4?


This API would allow you to do breakdowns in a single call... the behaviour is a bit different....


Essentially, you have to follow these steps:

  1. Create a Report using Report.Queue - you would get back an id
  2. Next, you had to keep checking the Report.Queue for your Report ID to be completed (this is where the process was a slow, the report wasn't done immediately, you need to keep checking until it's done)
  3. Once done, you can now get your Report using Report.Get


However, you can basically get dynamic breakdowns of your dimensions...


{
	"reportDescription": {
		"reportSuiteID": "[suitename]",
		"dateFrom": "2024-01-01",
		"dateTo": "2024-01-18",
		"metrics": [{
			"id": "orders"
		}],
		"elements": [{
					"id":"products",
					"selected": ["product1","product2","product3"]
                },{
					"id": "eVar1"
		        },{
			        "id": "eVar2",
			        "top": "50"
		}]
	}
}


This should bring back the top 50 eVar2 values, under each eVar1 value, under each of the three selected product values (product1, product2 and product3) (if I remember my syntax correctly)


You don't have to use "selected" or "top X" logic, but I thought it might help get you started to see that syntax in use.


The above call would return something like 1234566778 immediately, then you would have to keep checking the queue for this ID.. when done, you can retrieve the completed report.


https://developer.adobe.com/analytics-apis/docs/1.4/guides/reporting/methods/

View solution in original post

9 Replies

Avatar

Correct answer by
Community Advisor

I haven't used the API 2.0 much, but my understanding was that to "improve" performance, it didn't do complex breakdowns... hence the need to run multiple requests....


However, if you are trying to get a lot of breakdowns, it's not all that efficient... while not really recommended for new implementations, have you considered using the old API 1.4?


This API would allow you to do breakdowns in a single call... the behaviour is a bit different....


Essentially, you have to follow these steps:

  1. Create a Report using Report.Queue - you would get back an id
  2. Next, you had to keep checking the Report.Queue for your Report ID to be completed (this is where the process was a slow, the report wasn't done immediately, you need to keep checking until it's done)
  3. Once done, you can now get your Report using Report.Get


However, you can basically get dynamic breakdowns of your dimensions...


{
	"reportDescription": {
		"reportSuiteID": "[suitename]",
		"dateFrom": "2024-01-01",
		"dateTo": "2024-01-18",
		"metrics": [{
			"id": "orders"
		}],
		"elements": [{
					"id":"products",
					"selected": ["product1","product2","product3"]
                },{
					"id": "eVar1"
		        },{
			        "id": "eVar2",
			        "top": "50"
		}]
	}
}


This should bring back the top 50 eVar2 values, under each eVar1 value, under each of the three selected product values (product1, product2 and product3) (if I remember my syntax correctly)


You don't have to use "selected" or "top X" logic, but I thought it might help get you started to see that syntax in use.


The above call would return something like 1234566778 immediately, then you would have to keep checking the queue for this ID.. when done, you can retrieve the completed report.


https://developer.adobe.com/analytics-apis/docs/1.4/guides/reporting/methods/

Avatar

Community Advisor

The Reporting API is not designed to get "ALL" data. It is the same API being used by AA Workspace and is designed to get a small chunk of data iteratively and interactively.

If you really need to get ALL data using API, there will be lots of data expansions and iterations to get all combinations as you want. It can be a very slow and ineffective process.

The more effective and efficient approach to getting a large amount of data is using the Data Warehouse or Data Feed. Data Warehouse is an experience closer to the Workspace and you can use segments in creating the request. Data Feed is the ultimate raw hit level data you can have but will require a deeper knowledge to calculate certain metrics and build segments from scratch if required.

Avatar

Level 1

Hello ,

Thanks for explaining but I have couple of question to ask :.

1. Even though the adobe api 2.0 doesn't provide all the data as per the multi dimension , but is there any workaround to get the data if the number of dimension is 8 and 15 metrics using the Adobe API 2.0 . Moreover  in the warehouse approach we doesn't have the "bounce rate" as the metric available.


Waiting for your response thanks


Avatar

Community Advisor

In this case, perhaps you may consider using Data Feed for raw hit-level data and calculating locally.

Avatar

Level 1

thanks for the suggestion ..


sorry couple of question :

1. Is there a way by using Adobe API 2.0 , can we fetch this much granual data of 8 dimension and their corresponding 15 metrics.

2. Is there a way we can leverage data warehouse to calculate "bounce rate"?

3. Also one more thing , is this the correct url : https://{company_id}.analytics.{region}.adobe.com/discovery/{rsid}/trended to fetch the data using adobe analytics 2.0

Avatar

Community Advisor

API 2.0 is "fast" because it limits what you can pull back at once... that's why when you are doing breakdowns, you have to make multiple requests... one for each breakdown.


API 1.4 allowed for "all in one" calls because of the queuing system.


However, if you are basically looking for "Dimension X", for a list of Y values from that dimension, you should be able to do that with a segment.


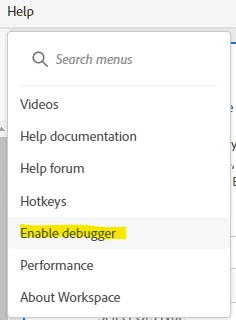
A little known fact of that Workspace is built using API 2.0, so if you can build what you want in Workspace you can get access to those queries to use as is, or to modify them.


First turn on Debugging:

Jennifer_Dungan_0-1725457043857.png


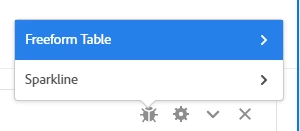
This will add a new icon to your tables:

Jennifer_Dungan_1-1725457067003.png


Clicking on the icon will bring up the option to get the API for the table or the Sparkline... choose the table.

Jennifer_Dungan_2-1725457092089.png


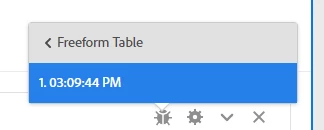
You will then be presented with one or more timestamps, clicking on each of these will pull up a page with the API call used in multiple formats that you can copy and use.

Jennifer_Dungan_3-1725457131184.png


As for Data Warehouse, I don't thing you can get the data required to calculate the bounce rate.... Metrics like Entries, or Bounce, or Single Page Visits, etc... 


However, you should be able to use Report Builder for that, which would be easier than setting up a process to parse Raw Data feeds...

Avatar

Level 1

thanks 


But i think you missed my last question ,

3. Also one more thing , is this the correct url : https://{company_id}.analytics.{region}.adobe.com/discovery/{rsid}/trended to fetch the data using adobe analytics 2.0

Avatar

Community Advisor

Ah you're right, I did miss the last question... that one I am not sure about... I don't have an active APIs running at this time.. Adobe also has multiple API endpoints... 


Most of the examples I see seem to use:

https://analytics.adobe.io/api/{GLOBAL_COMPANY_ID}/


Followed by the endpoint, then by more specific information about the suite and what type of pull is being made... 


but maybe someone with some active APIs would be able to answer this better.. Previously we used API 1.4, and while I have done some labs with 2.0 in the past, I haven't used it for real integrations.

Avatar

Community Advisor

The "debug" method shared by Jen is the best way to learn about how to use Analytics API 2.0 by examples from Analytics Workspace.

However, iterating through 8 dimensions could be exhaustive and have performance issues as you pointed out in the original post. If there are 5 unique values in each dimension and you are expecting a full combination of all of them, there are 390625 combinations from 7 levels of looping over 78125 iterations, where you may end up with an HTTP 429 error on too many requests.

Of course, the story will be very different if you do not require a full combination of all values from 8 dimensions.


Unfortunately, there is no bounce-related metric or dimension available from Data Warehouse, which makes it not an option.


The 2.0 API for reporting is POST "https://analytics.adobe.io/api/{global-company-id}/reports" and you can find the reference at Reporting API (adobe.com). You need the global-company-id from the discovery API "https://analytics.adobe.io/discovery/me" or you can simply observe that from the Adobe Analytics URL on your browser.