
Workspace, allow us to set visualization labels at the column level of the freeform table as well as in the visualization
Being able to set labels in our visualizations is great, we can immediately see where the label is going and how it will look... but the problem comes when the freeform table has the slightest change (like the dimension breakdown, which doesn't impact the columns), forces the labels to re-populate with the default value.
Let's take a simple example.
I create a freeform table with Referrer Instances at the top, and that broken down into columns by Referrer Type. Then I use Day as my dimension.
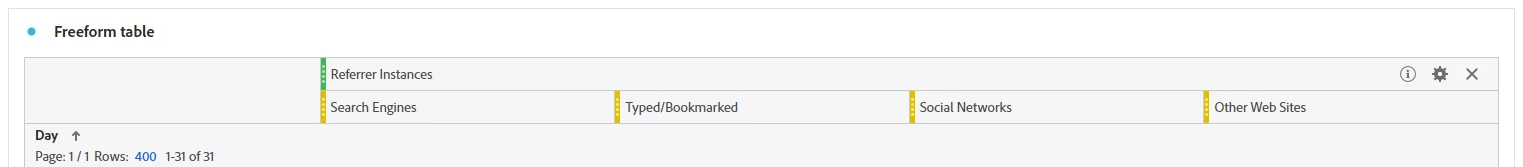
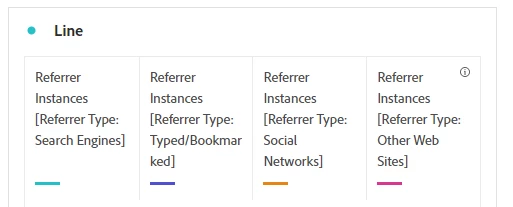
When I visualize this, what do I get:
- Referrer Instances [Referrer Type: Search Engines]
- Referrer Instances [Referrer Type: Typed/Bookmarked]
- Referrer Instances [Referrer Type: Social Networks]
- Referrer Instances [Referrer Type: Other Websites]
Since I am going to label my visualization and add a description of what this data is, I don't need it repeated in this fashion all through the legend labels. I want them to be clean, not this ugly version:
So here is where renaming comes in, great! Love that I can rename them. (Search, Direct, Social, Other - done)
But here's where the issue of the default comes in... let's say I want users to be able to select a set of rows from the table to focus on one part of the overall data.... the labels on the visualization reset to the default values...
Or if I want to duplicate a table to do a different dimension... I want my columns to have the same visualization labels, but I have to rename every iteration.
So in some cases I am wasting time on every report re-labeling the same sets of columns to make the report look presentable... or having to leave the defaults in there because once users start selecting rows it makes no difference cause I can't control what shows...
There is obviously a need for these default generated values (something that we can always revert to), but I would love to be able to also set "actual values" or even "defined how the auto-label should populate" at the column (or even report level - even if it's take the "top" or "bottom" value (metric or segments, etc) on stacked value, or concatenate in this order, etc (I'm sure there are a lot of options that could factor into this). The modify at visualization level would then take priority over that.
So it would be (in order of prioritization):
1. Visualization Level Set Value
2. Column Level Set Value (new)
3. Report Level Custom Generated Values (new)
4. Standard Default Generated Values
Providing more control on how our labels are generated could save so much time on creating and styling our reports, and make the interactivity of the reports work better and more consistently with what our users would want to see (ease of reading)