

Allow Count Distinct for Dimensions in Histogram Visualization
Description - Today, we can utilize the Histogram Visualization in Workspace with any event. Under the hood it creates a lot of Segments, which is also super helpful when we need those Segments for other use cases. However, a lot of engagement use cases would largely benefit from using the Count Distinct function in Segments. Some simple example could be:
- How many different pages do users view in a Visit?
- How many Marketing Channels do Visitors use in a month?
- (for CJA) How many different devices do people use?
Functionally, we could just add dimensions as another option for the selector dropdown, which would internally build the Segments based on the Count Distinct function instead of the normal Segment definition.
Why is this feature important to you - To better understand user or session engagement.
How would you like the feature to work - Allow dimensions to be dropped or selected in the selector:
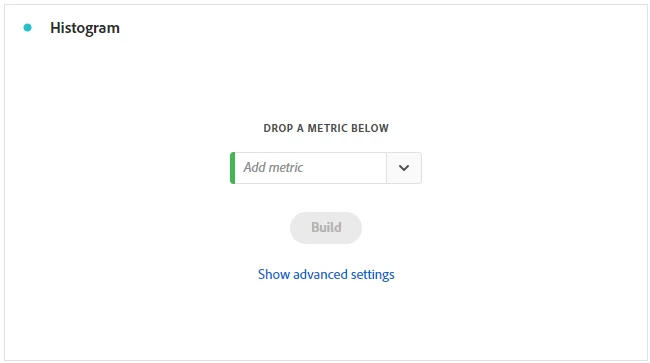
Current Behaviour - Only events are supported and building engagement Segments takes a lot of effort.