


Beyond activation: What video engagement reveals about the value of Dynamic Media content
In my earlier post, What your Dynamic Media assets do after they leave the DAM, I stepped into the shoes of a growth marketer at fictional fashion retailer Luma Retail. I used the Dynamic Media Delivery Report to explore which assets were being delivered and how activation varied across channels, SKUs, and markets.
At Luma, we have recently revamped our video content strategy. So I wanted to answer the next question: once our videos are delivered, how often does playback occur relative to video loads, how long are videos watched, and which content earns greater engagement?
To find out, I analysed one month of Video Engagement Report data from the Dynamic Media New Video Viewer for 20 Luma videos. Together, they generated 7.93 million impressions, 178,280 views, and 5.42 million watched seconds. More importantly, the engagement signals gave me a new input into Luma’s content strategy: what to activate more widely, what to optimize, and what to test next.
You can explore the sample dataset used for this analysis here (links to a google sheet).
The New Video Viewer of Dynamic Media
The New Video Viewer provides a modern, customizable and performant playback experience and captures structured playback events. The Video Engagement Report converts those events into monthly, per-video metrics such as impressions, views, watched seconds, play rate, average watch time, completion rate, and engagement score.
As Luma Retail’s growth marketer, this helps me move beyond knowing that a video was delivered. I can see how often playback occurred relative to video loads, how long videos were watched, and how often playback reached the end of the video timeline. These signals help me understand how audiences engage with the content and identify videos that may deserve wider activation, optimization, or deeper analysis.
Note: The Video Engagement Report is supported only for videos played through Dynamic Media New Video Viewer. It is available across both Dynamic Media (Scene7) and Dynamic Media with OpenAPI.
Here are three insights I found in Luma’s video engagement data.
Three insights from Luma’s video library
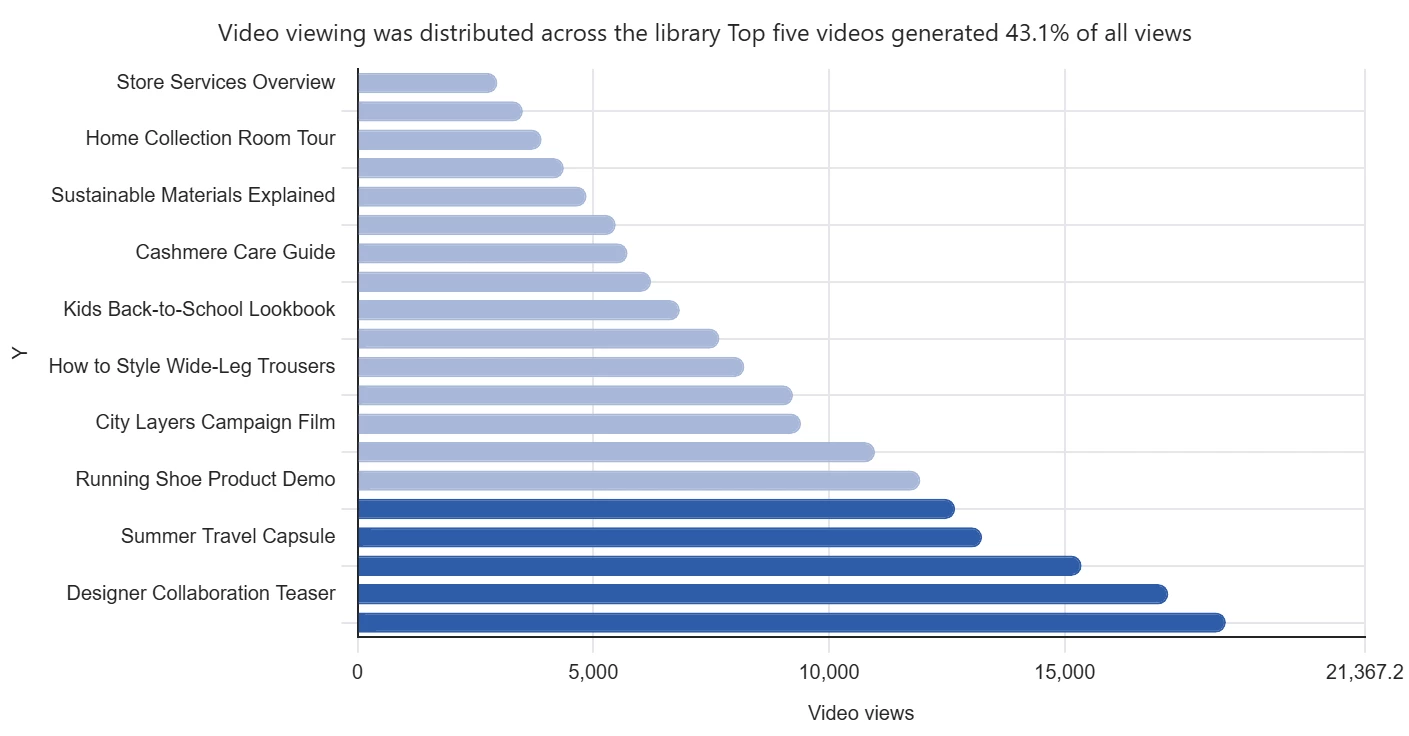
Views were distributed across the video library
The five most-viewed videos generated 43.1% of all views. These were SS26 Coastal Edit Hero, Designer Collaboration Teaser, New Arrivals Weekly Edit, Summer Travel Capsule, and Linen Dress Product Story.
More than half of Luma Retail’s video views came from the remaining 15 assets. This suggests that Luma should not evaluate video performance only through its hero campaigns. The long tail of product demonstrations, styling content, service explainers, and campaign assets collectively accounted for more than half of all views. That makes library-wide measurement important when deciding what to reuse, promote, or refresh.
Practical content earned stronger play rates
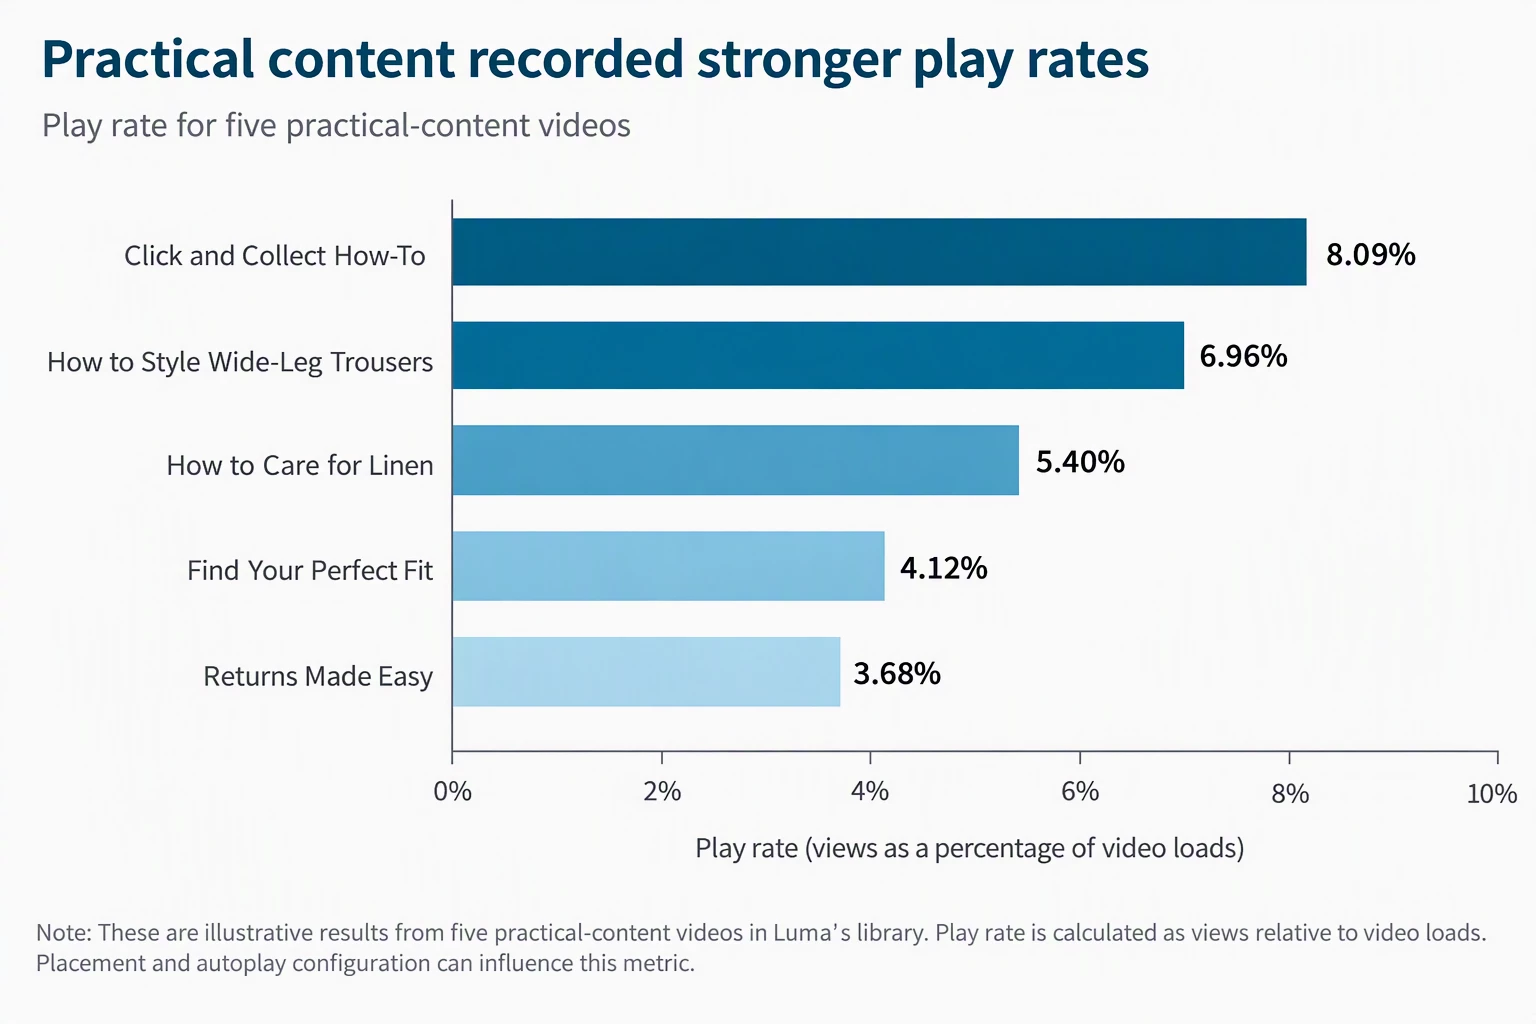
Click and Collect How-To achieved the highest play rate at 8.09%, followed by How to Style Wide-Leg Trousers at 6.96%. Although these videos received fewer impressions than the largest campaign assets, they recorded higher play rates relative to video loads. For Luma, this creates a useful hypothesis: practical, task-oriented content may generate stronger playback engagement than broad campaign content. However, play rate should be interpreted alongside factors such as placement and autoplay configuration.
Shorter videos recorded higher completion rates
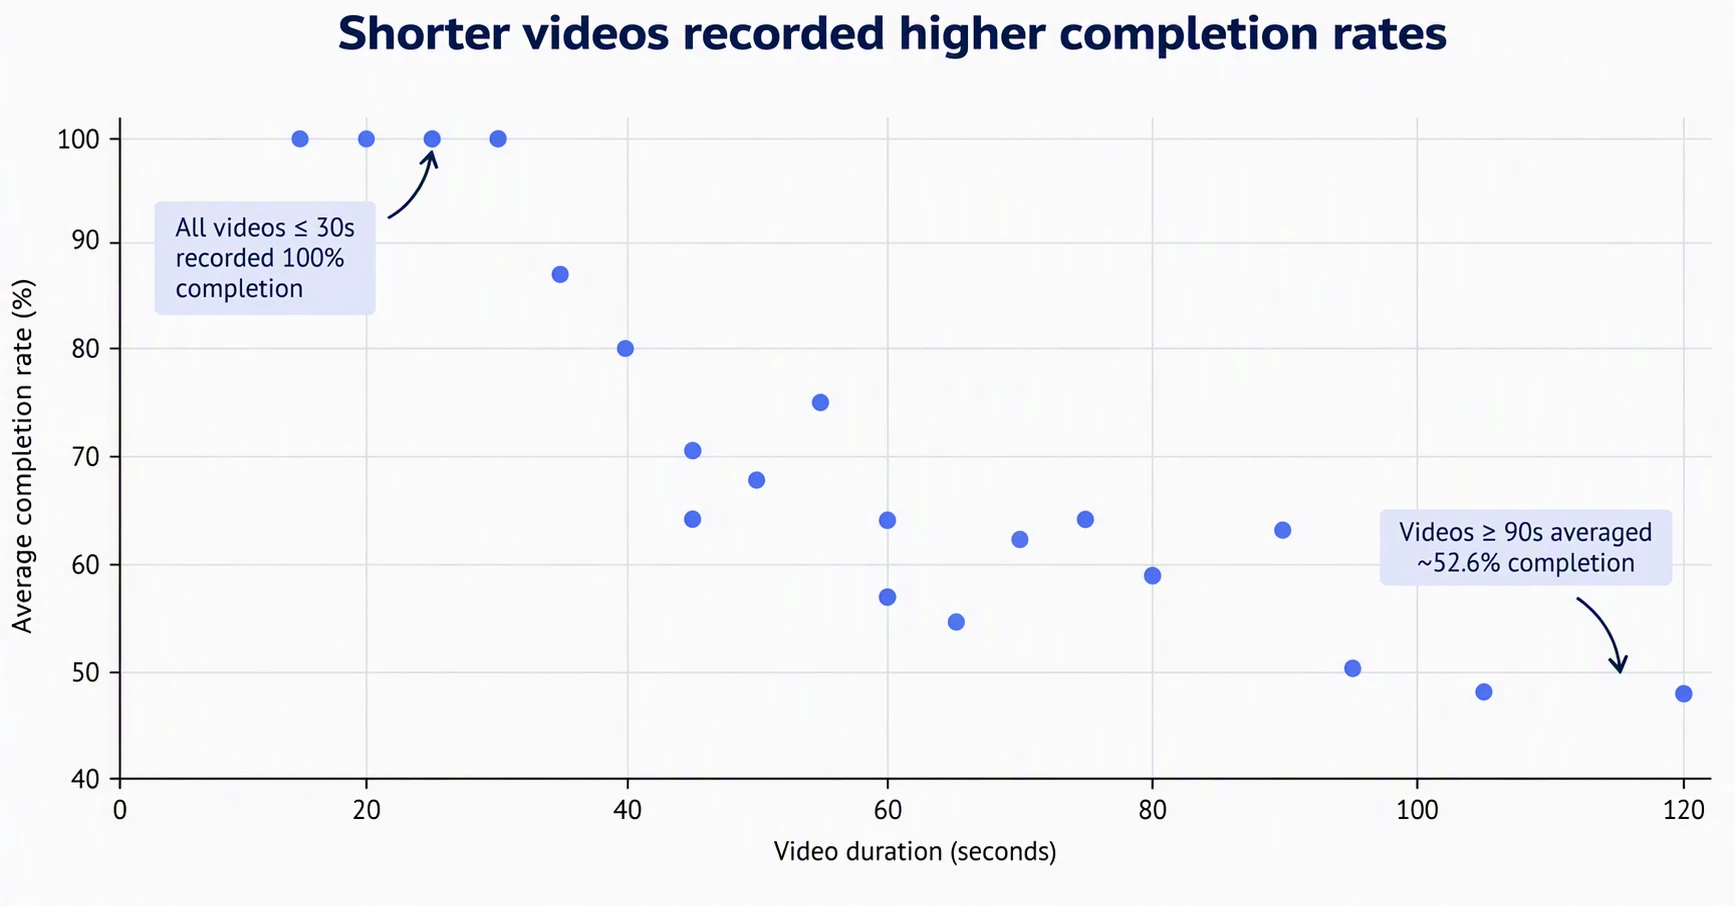
All four videos lasting 30 seconds or less recorded a 100% completion rate in this illustrative dataset. The four videos lasting 90 seconds or more averaged 52.6%. Here, completion means that playback reached the end of the video timeline; it does not necessarily mean that every portion of the video was watched. This does not mean every video should be shortened. Instead, Luma could use duration and completion together to identify videos and experiences worth testing further.
Bringing the signals together
Looking at these metrics together can be more useful than interpreting any one of them in isolation. For Luma, different combinations of delivery and engagement signals can point to different questions worth investigating:
| Delivery and engagement pattern | What Luma could investigate |
| High delivery, low play rate | Review placement, thumbnail, autoplay configuration, and content relevance. |
| Low delivery, high play rate | Test greater exposure in relevant customer journeys. |
| High play rate, low completion | Examine video length, opening content, pacing, and whether the video meets the audience need. |
| High completion, low delivery | Investigate discoverability and whether the video is being surfaced to enough relevant audiences. |
These patterns are not conclusions on their own. Instead, they provide signals that can help Luma decide what to investigate or test next.
Conclusion
Delivery tells Luma that a video reached an audience. Engagement adds the next layer: how often playback occurred relative to video loads, how long videos were watched, and how often playback reached the end of the video timeline.
These signals do not replace conversion or revenue measurement, and they do not explain by themselves why a video performed as it did. But when combined with delivery data and business outcomes, they help the team form better hypotheses, decide which videos deserve wider activation, and identify where content, duration, or placement should be tested.
For Luma, that turns video reporting from a record of what was delivered into an input for the next content decision.