Question
Request Report Chart
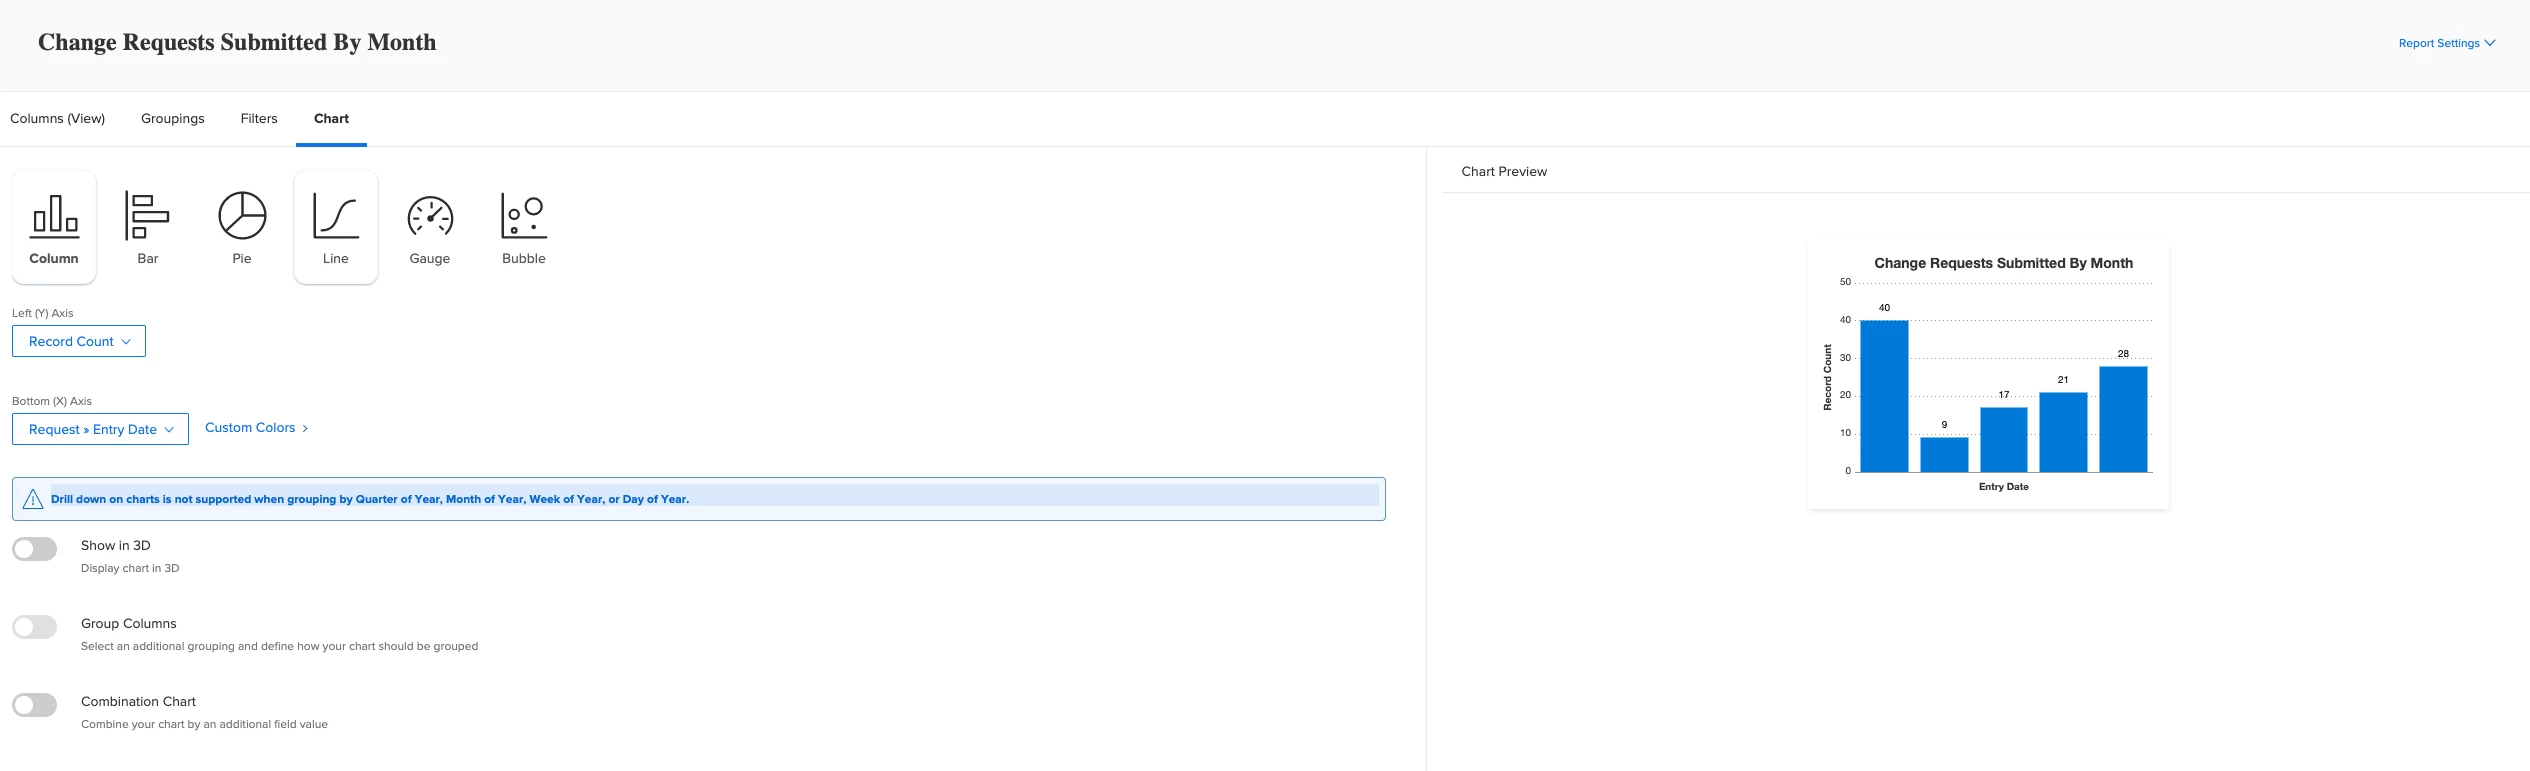
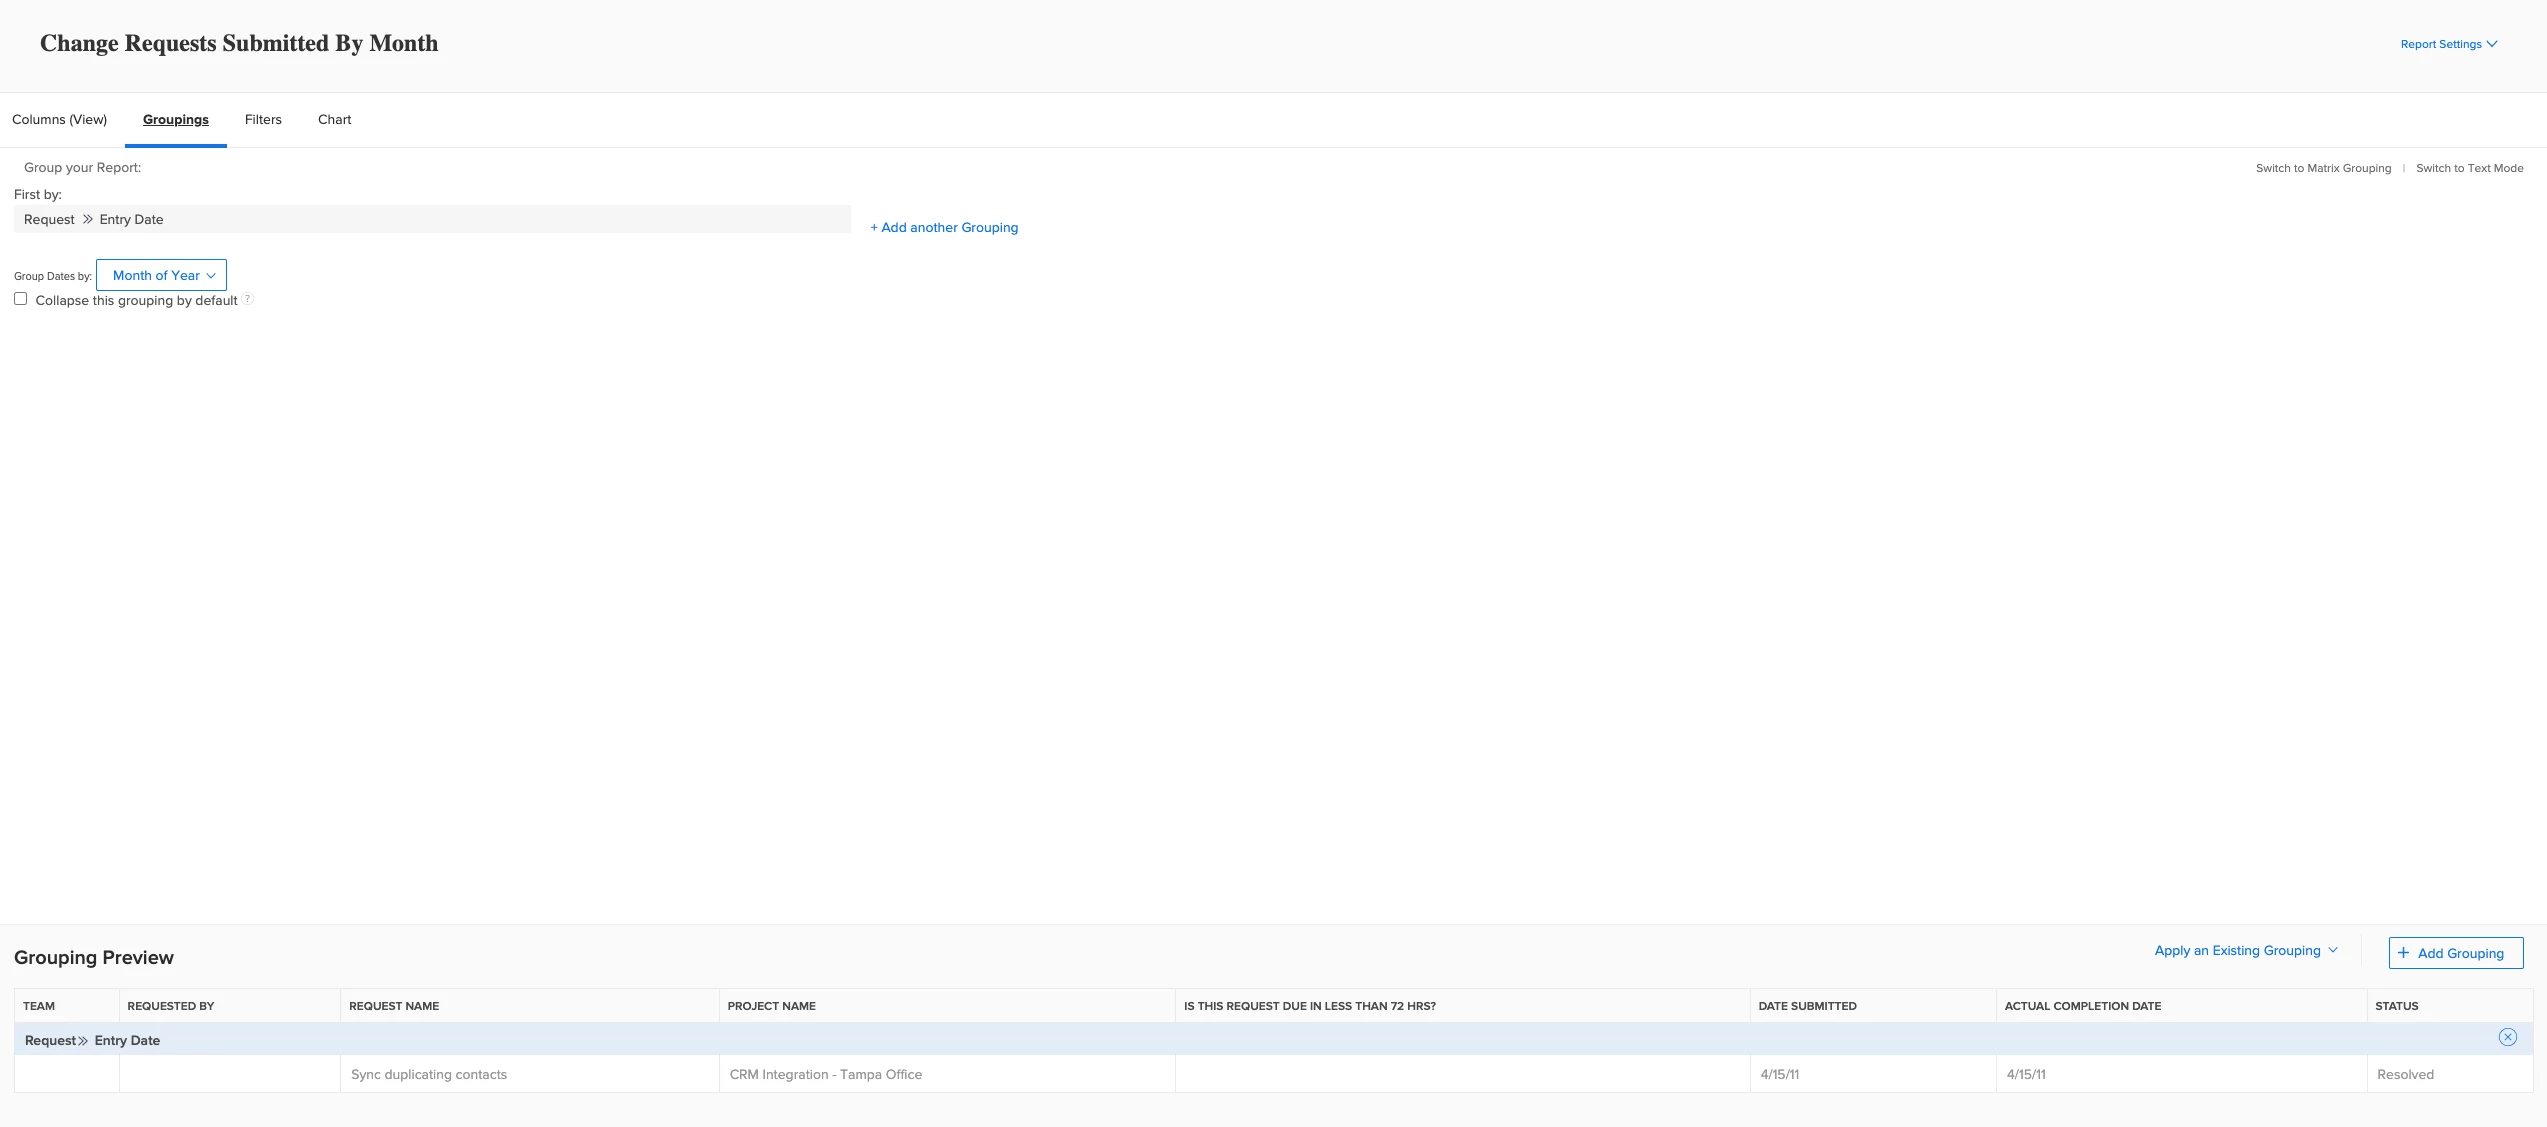
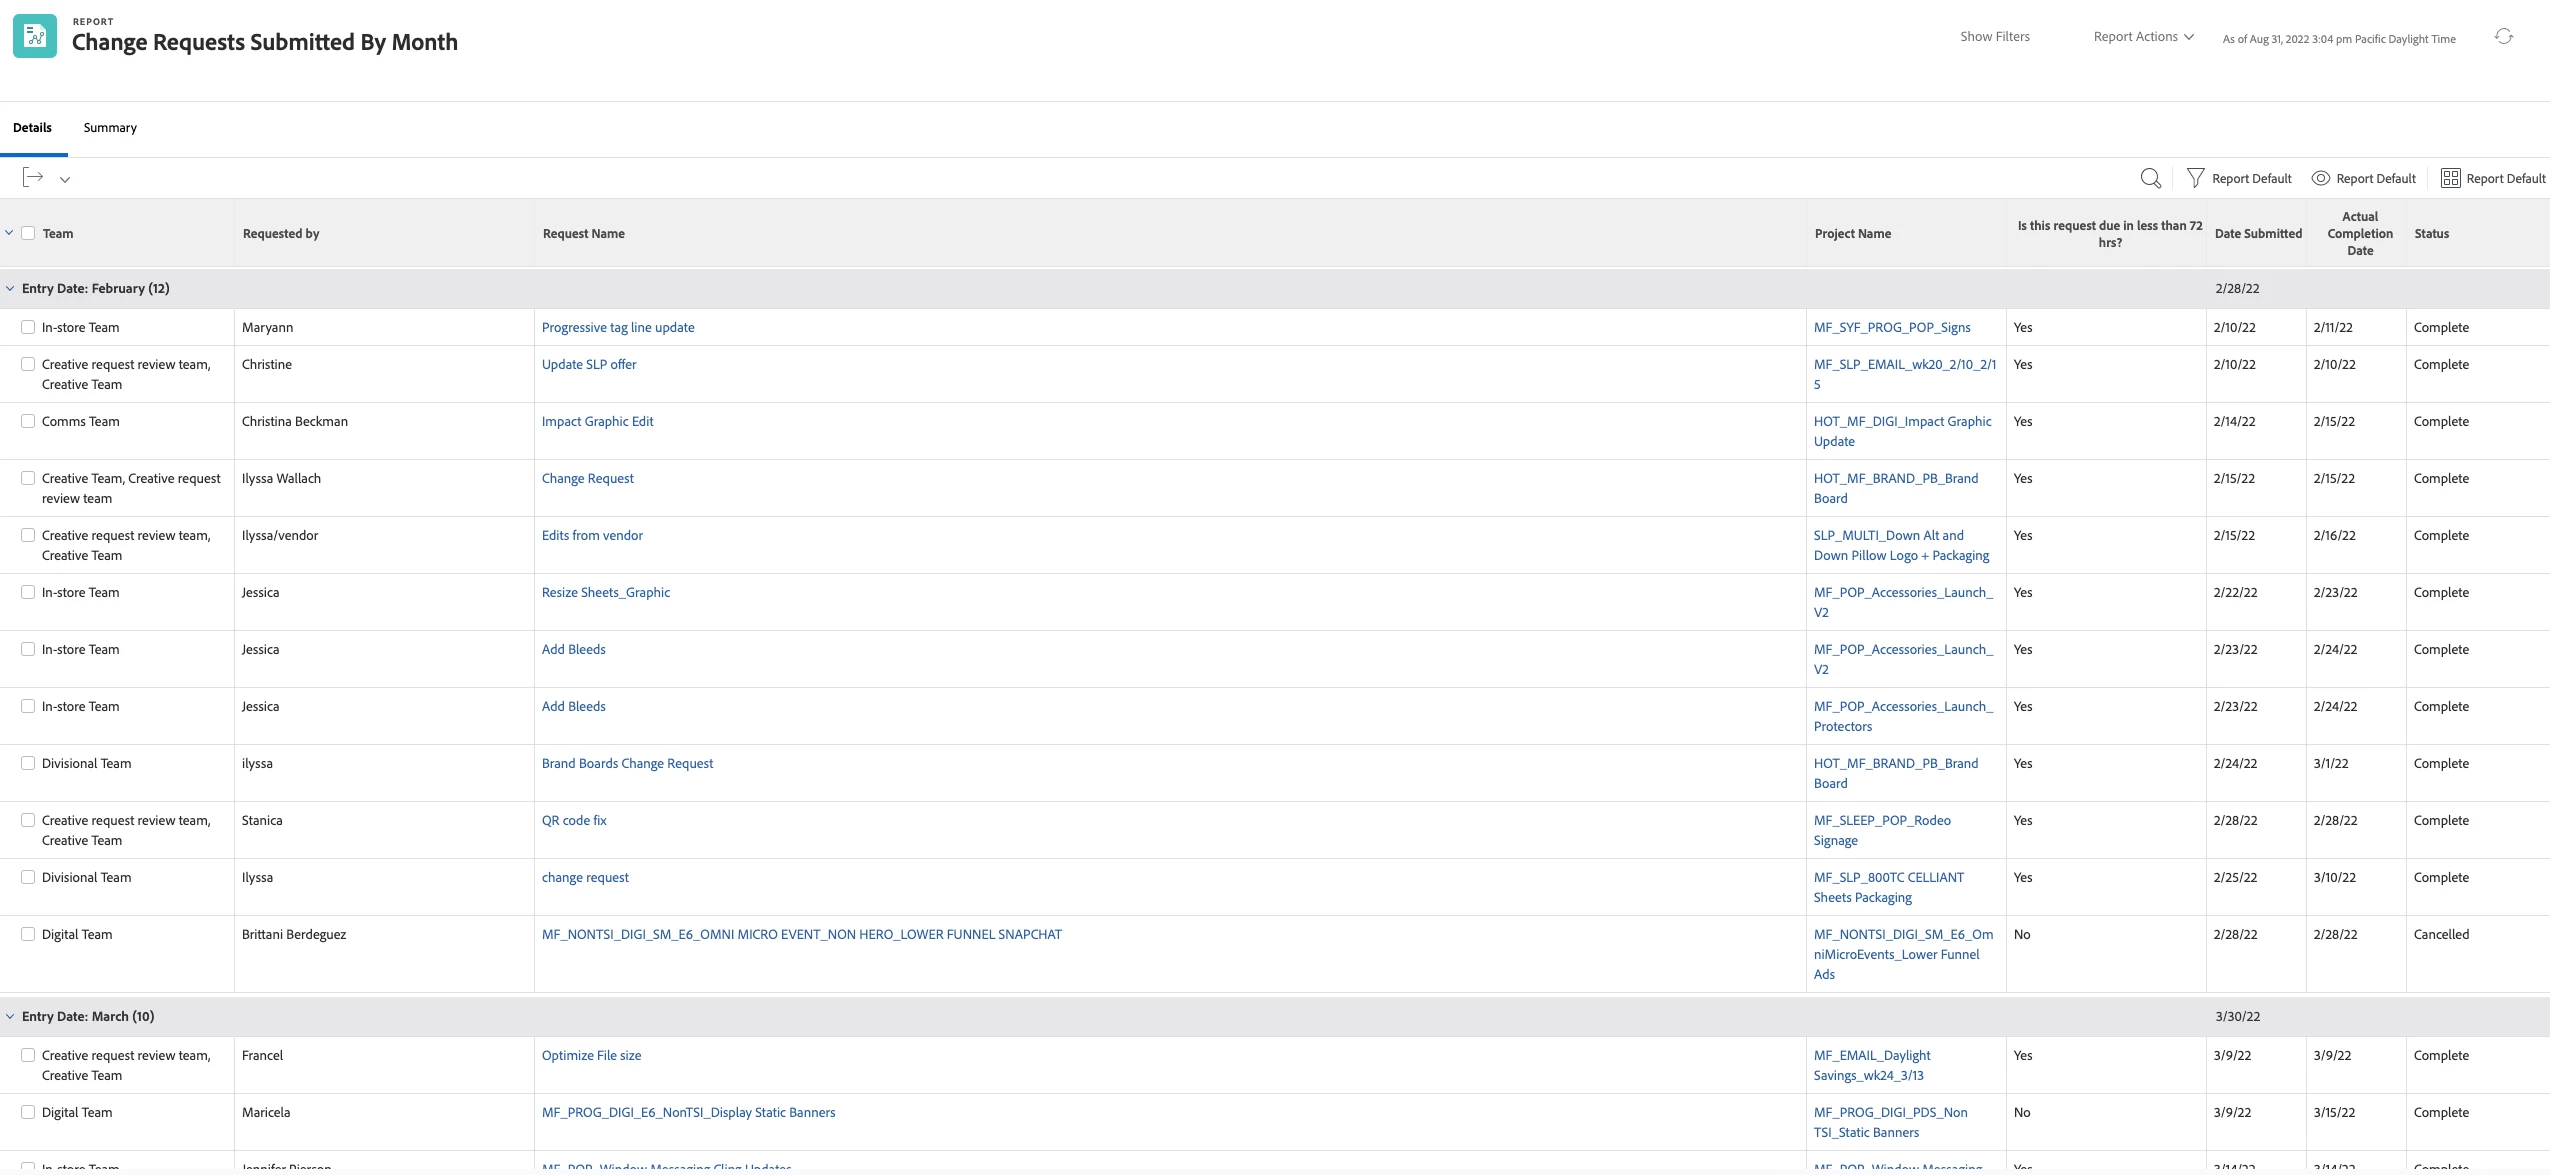
I'm trying to create a chart showing change requests submitted by month chart from my request report in order to visually see the count by month of the year. I can see the groupings under summary and details are pulling up correctly, but the chart section is not pulling up in the report view. Below are screenshots of my settings in the chart and grouping areas with a screenshot of how my report looks. Is there something I'm missing? I've created project report charts successfully, so not sure why the request report chart feature isn't working.