Report Groupings: Text Mode Grouping shows up in Report Details, but Grouping does not work in Summary or Chart
I'm creating an Issue report that groups first by the Resolve Project Owner and then by the Queue Topic Name on the issue. I've used Text Mode to do this grouping:
group.0.displayname=Resolve Project Owner
group.0.valuefield=resolveProject:owner:name
group.0.valueformat=HTML
group.1.linkedname=direct
group.1.namekey=Queue Topic Name
group.1.valuefield=Queue Topic Name
group.1.valueformat=customDataLabelsAsString
textmode=true
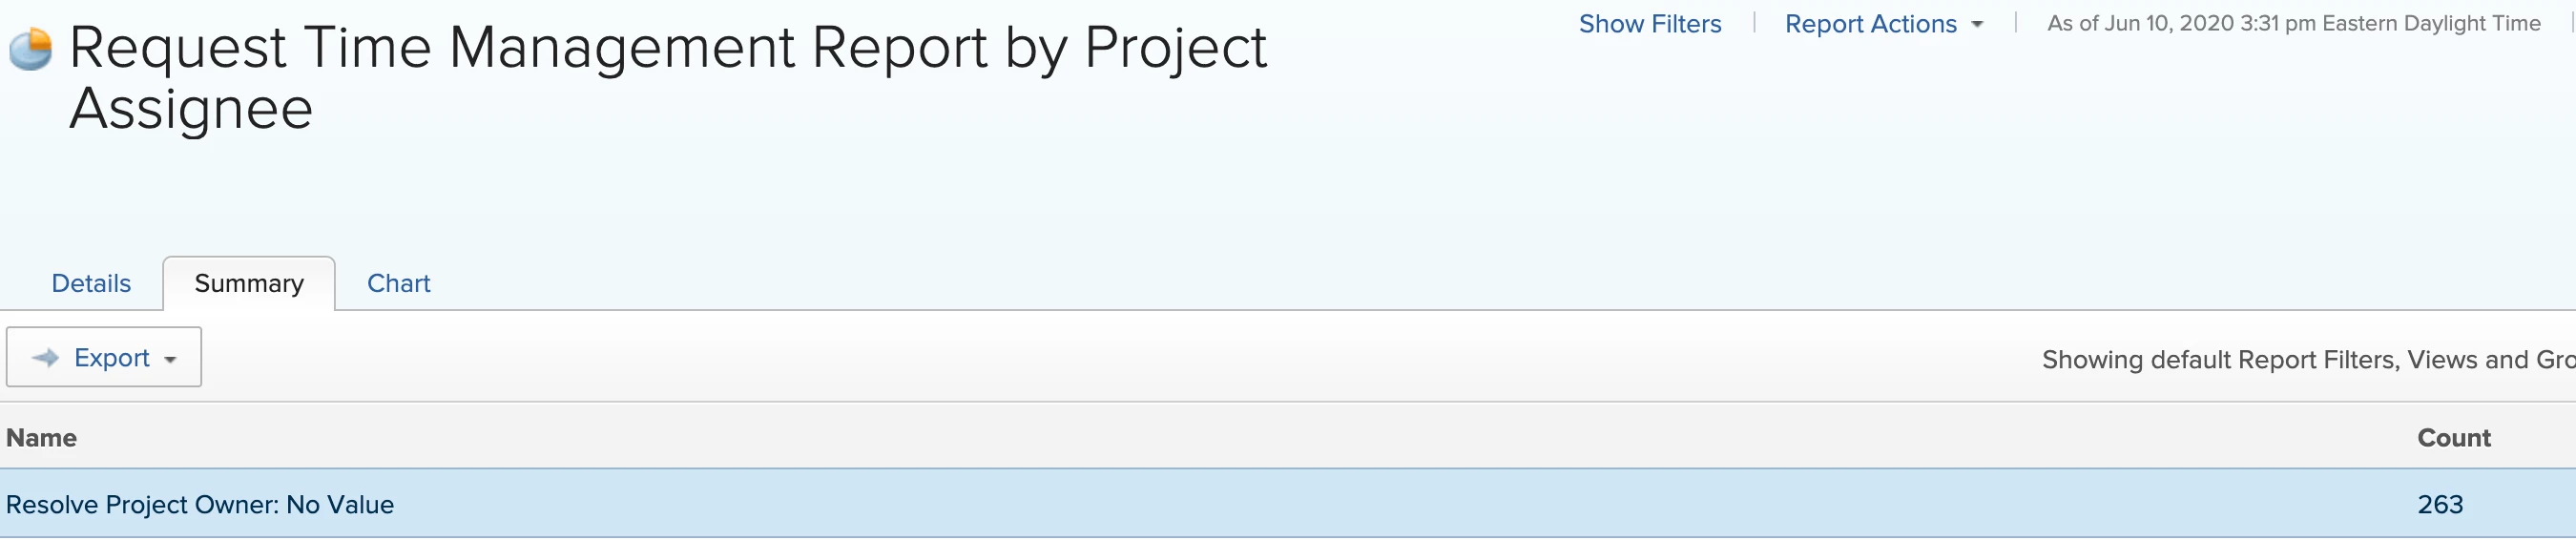
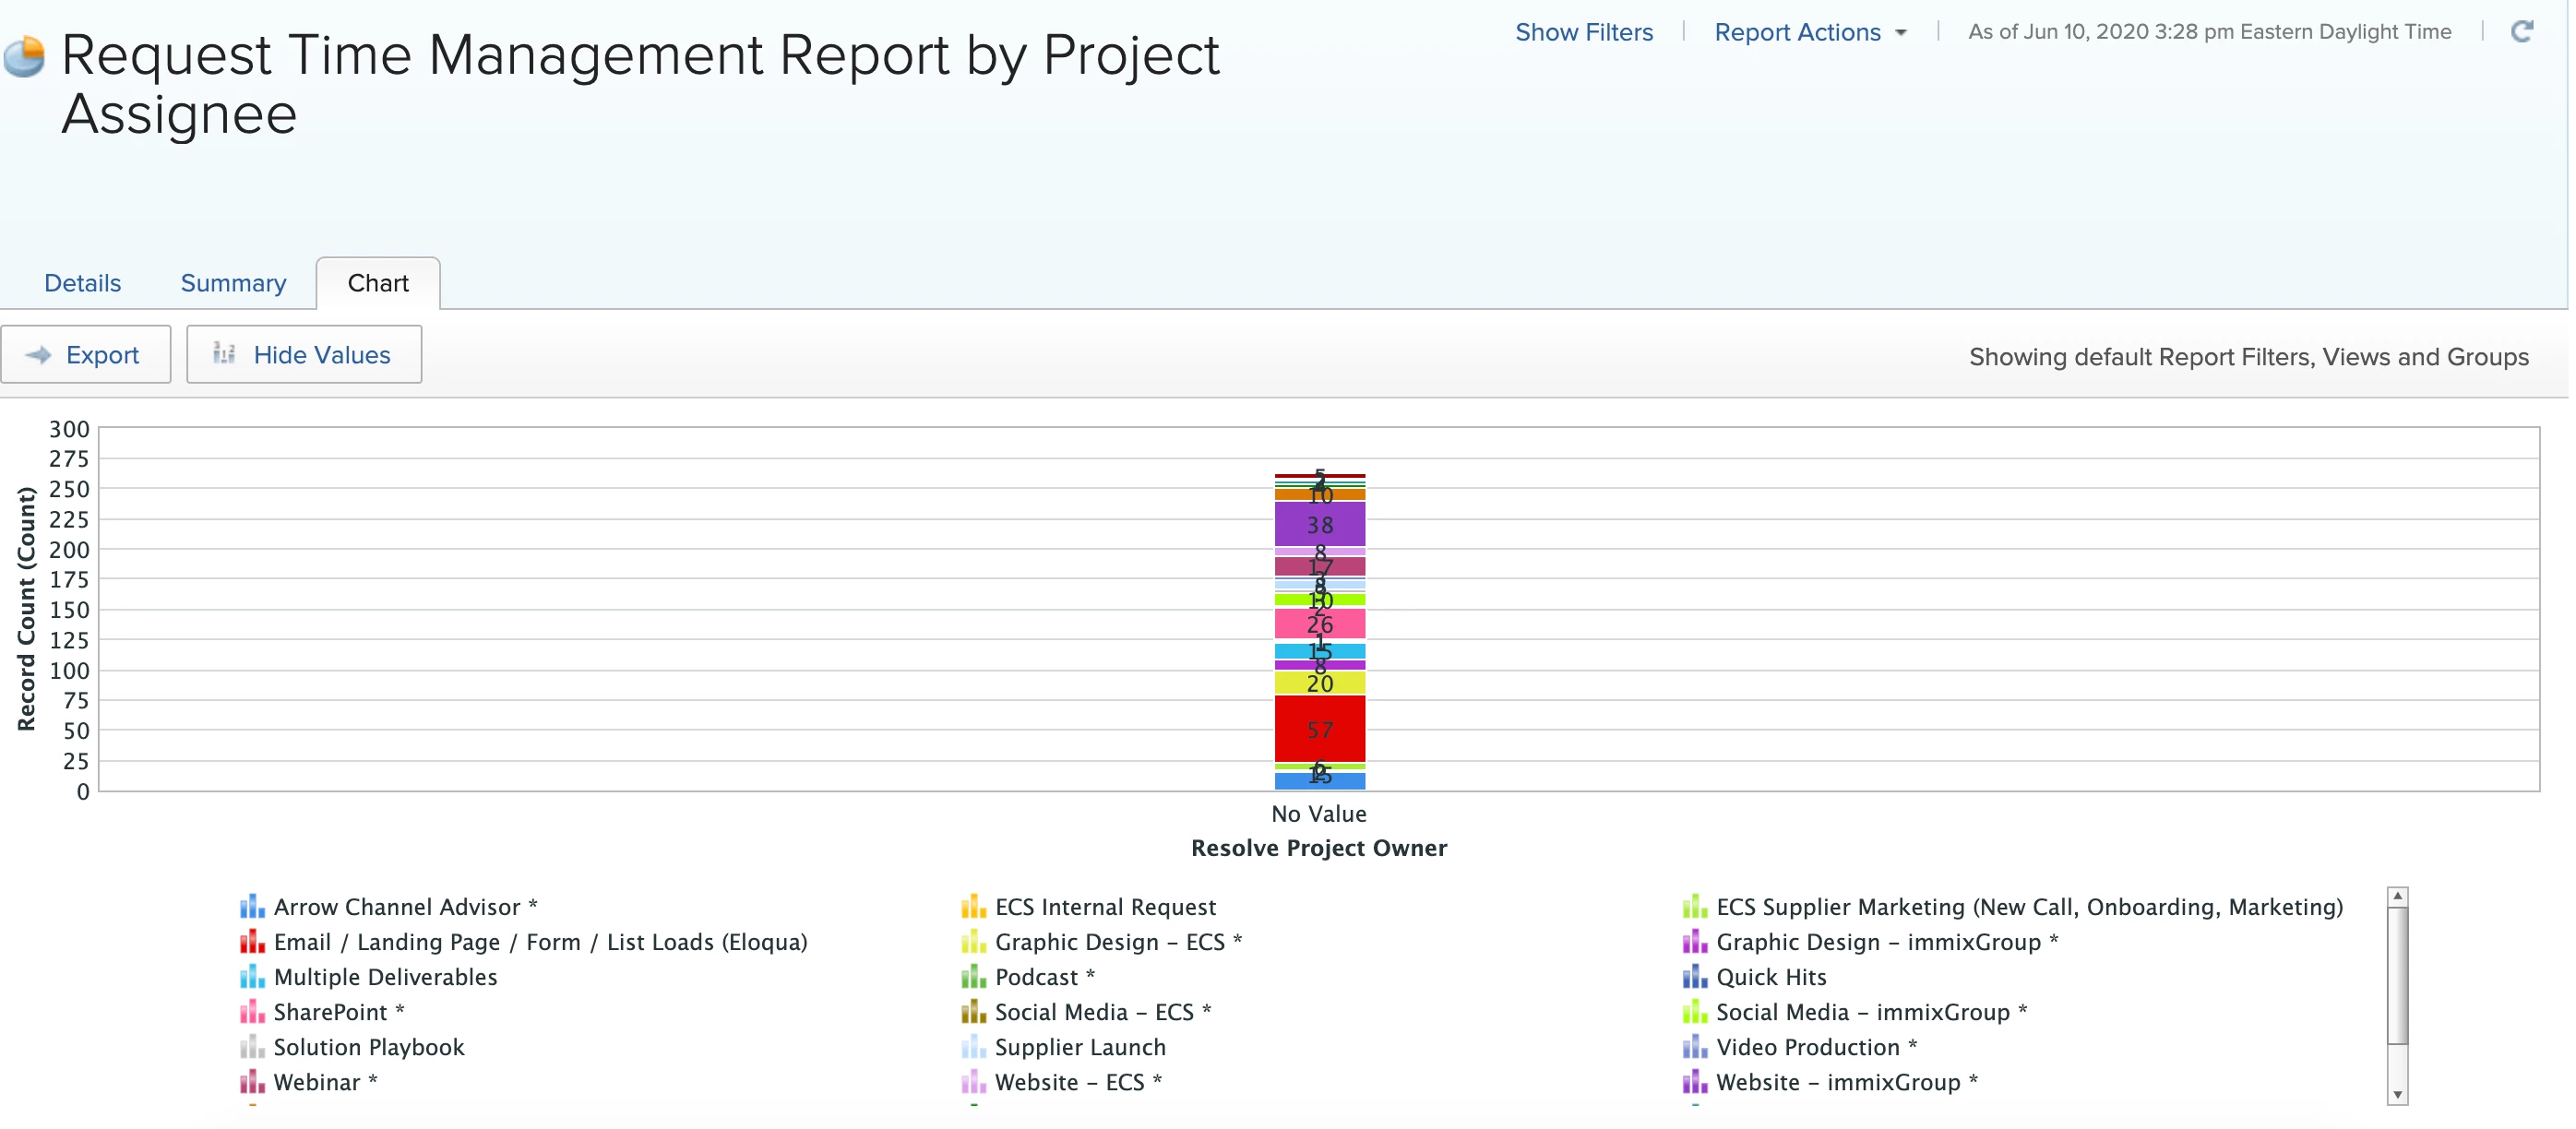
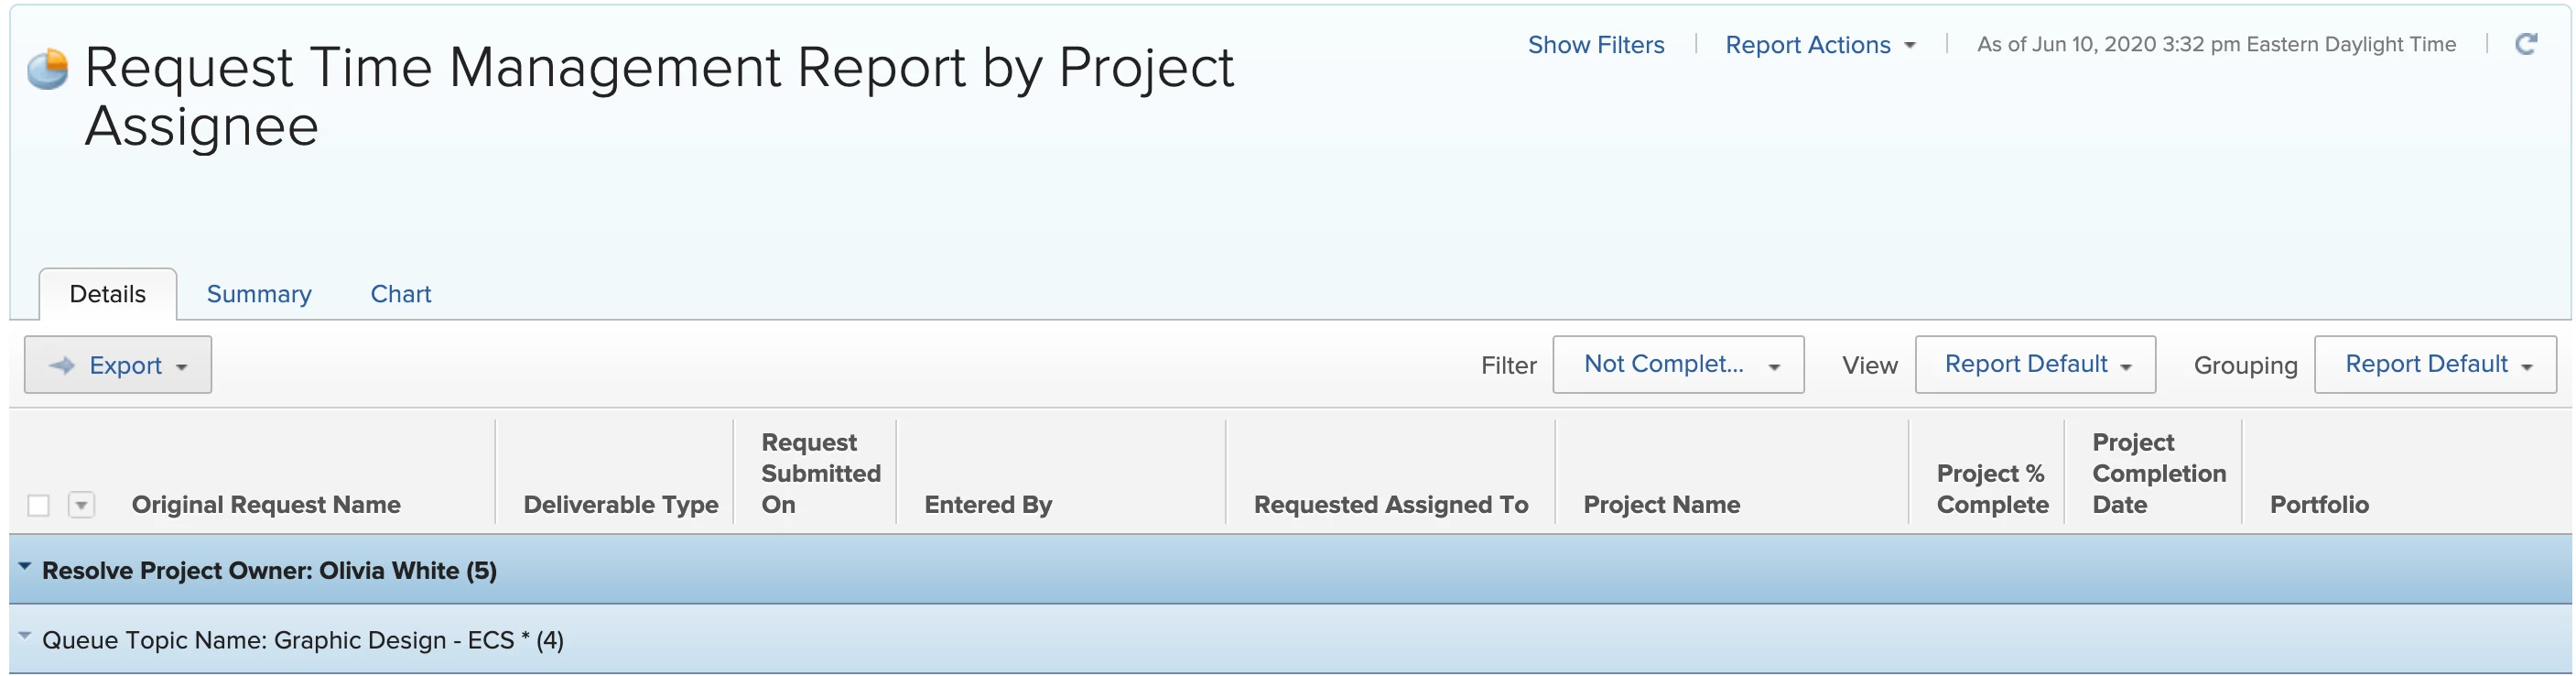
The Details report does this, but when I look at the Summary, it says the Resolve Project Owner = No Value. I created a Stacked Chart, where the Y axis is the record count and the X axis is similarly grouped, first by Resolve Project Owner, then by Queue Topic Name. The report groups the Queue Topics, but just creates a single column saying that the Resolve Project Owner = No Value.
See attached screenshots. Please help me out!