Present Project Dependencies within a portfolio | Community
Skip to main content
Farzaneh
Level 4
October 9, 2024
Question

Present Project Dependencies within a portfolio

  • October 9, 2024
  • 1 reply
  • 987 views

What is the best way to visualize project dependencies within a portfolio? Additionally, what data should be captured within projects—such as tasks, relationships, interdependencies, or any other relevant information—to ensure these dependencies can be properly visualized?

This post is no longer active and is closed to new replies. Need help? Start a new post to ask your question.

1 reply

Sven-atClient
Level 3
October 10, 2024

Hi @farzaneh 


Not really sure how to answer this: What are project dependencies? How would tasks and other information relate to the visualization of those dependencies? 

Farzaneh
FarzanehAuthor
Level 4
October 10, 2024

By project dependencies, I’m referring to situations where one project cannot start or progress beyond a certain milestone until another project completes a specific task or milestone.


If I understand correctly, inter-dependencies between projects can be created through issues or tasks. Is that correct? If so, how can we visualize these dependencies between projects within a portfolio? For example, would it be possible to display them in a Gantt chart view or another format? My executives are particularly interested in understanding the relationships between projects within a program or portfolio to make informed decisions about prioritization.

Doug_Den_Hoed__AtAppStore
Community Advisor
Community Advisor
October 27, 2024


Hi @farzaneh,


Since the inter-dependencies between projects you're describing effectively "push" each other, I'd recommend using Workfront's native Cross-Project Predecessor features. That said, they are a bit tricky to set up, manage, and report on (i.e. just a small cell tag on the native Gantt reports).


To help your executives understand the relationships between projects within a program or portfolio, I invite you to consider three related solutions we offer that might meet those requirements:


  • Our Roadmap solution lets you tag existing Tasks with data driven bar colors, fonts, and icons to efficiently generate real time professional Roadmap reports at various levels of detail
  • Our Timeline solution lets you choose one or more Critical Tasks, set their Path Colors, then view Timeline to trace the resulting multiple Critical Paths through all predecessors and feeder projects
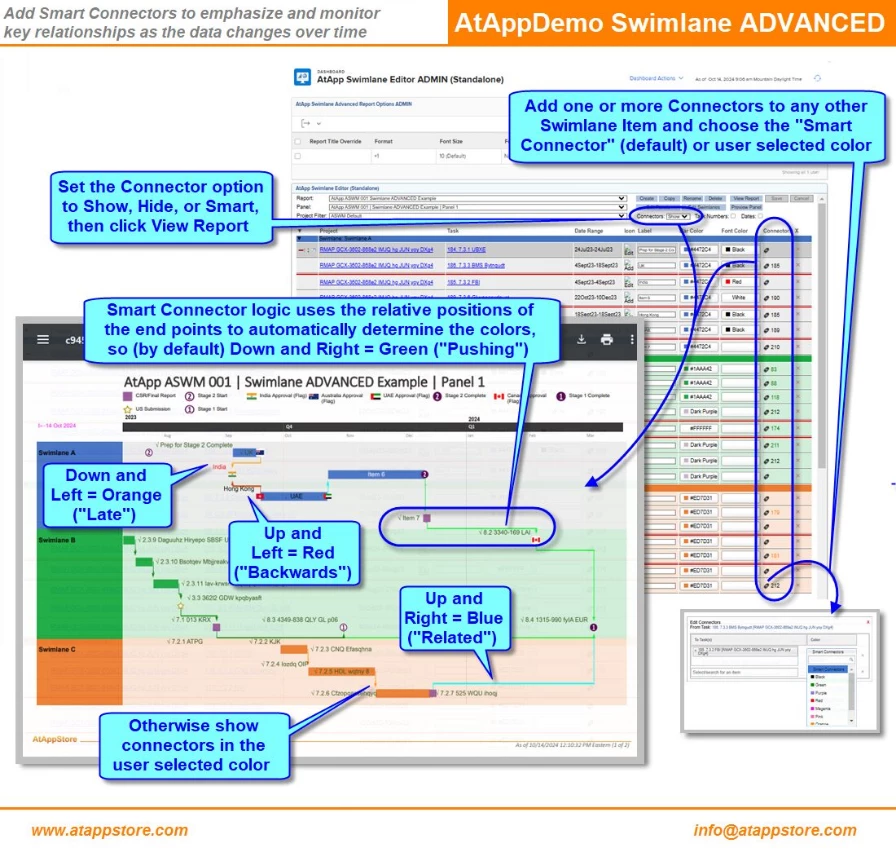
  • Our Swimlane ADVANCED solution lets you draw the Big Picture Your Way by creating Swimlane reports with customizable Panels, Timeframes, Swimlanes, Icons, Labels and Colors.

We recently added our new Smart Connectors feature to the latter to literally connect the dots with lines (see below), which we'll be adding in due course to the other two solutions, too. If you'd like to chat further about any of them, I'd be happy to connect via doug.denhoed@atappstore.com.


Regards,

Doug