Pie chart off of a grouping containing an IF statement?
Is there a way in the out-of-the-box Workfront reporting to create a pie chart off of a grouping that contains an IF statement? I believe the answer is no, but want to see if anyone has successfully done this.
My scenario...
We have a custom field called "work type effort" which exists on both "requests" (aka issue in WF speak) and "projects".
I have an HOURS report where if the time logged was a request/issue, show the request's work type effort, else show the project's work type effort (for time logged to tasks).
I successfully created the column and the grouping using the IF statement:
group.0.displayname=Work Effort Type
group.0.iscollapsed=true
group.0.linkedname=opTask
group.0.namekey=view.relatedcolumn
group.0.namekeyargkey.0=opTask
group.0.namekeyargkey.1=Work Effort Type
group.0.valueexpression=IF(ISBLANK({opTask}.{DE:Work Effort Type}),{project}.{DE:Work Effort Type},{opTask}.{DE:Work Effort Type})
group.0.valueformat=HTML
textmode=true
And the list view of the report groups correctly:
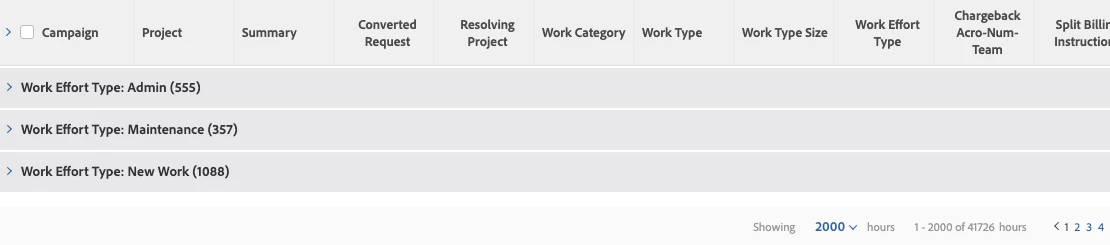
Problem is the PIE chart doesn't seem to understand my gouping. On set-up, it shows "Hours > " then on the pie chart shows everything at No Value.
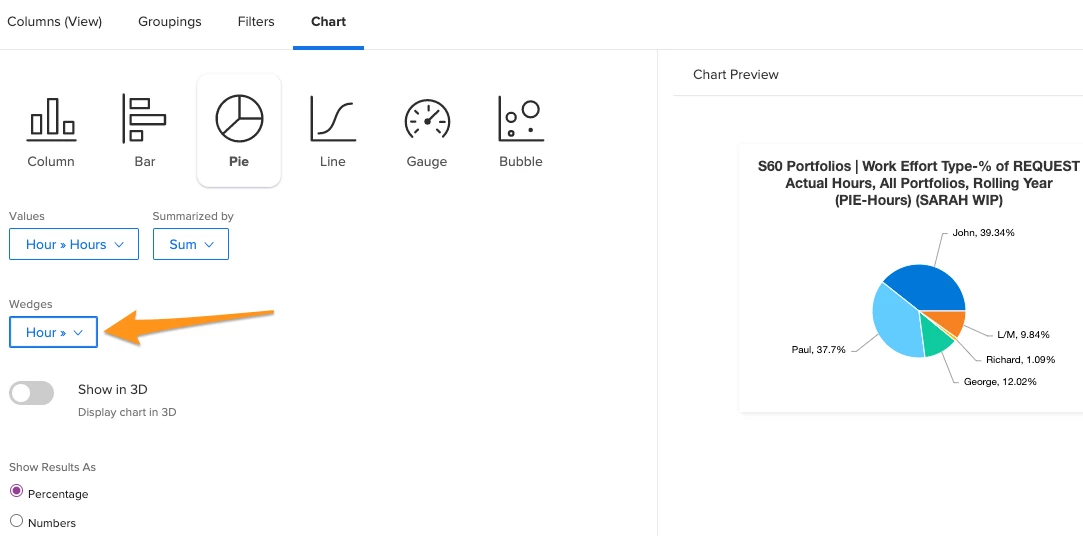
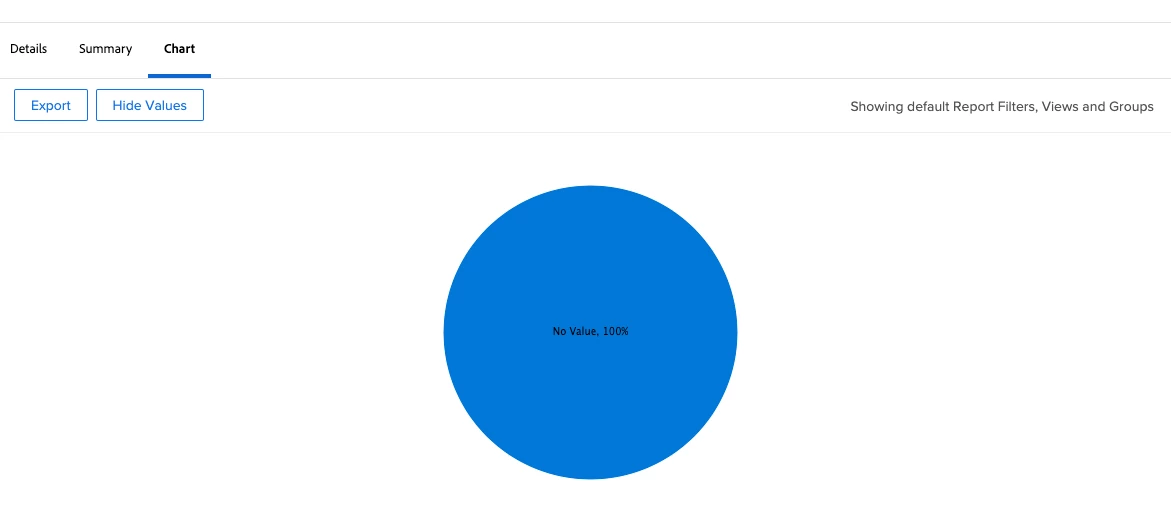
Any way to get a chart to render off of a IF statement in a grouping in native Workfront?
I know I can export to Excel and do it there but I want senior leadership to just use Workfront dashboards.