🎯 MarCom Gantt [VIDEO + DISCUSSION]
BACKSTORY
Have you ever wanted (or Been Told by someone who wanted) a way to easily make Program level long range plans so that you can rough out your timelines within Workfront? It's pretty common across all industries: Marketing/Agencies need to plan campaigns, BioTechs need to plan clinical trials, Manufacturing Companies need to plan capital projects, and so on.
A Gantt Chart is a great way to show such long range projects...but setting them up actually takes a fair bit of effort: Portfolio > Project > (placeholder) Project > (placeholder) Tasks to represent Phases > Predecessors > Dates...oh, and woe be to yee if an actual date sneaks in there that trips you up trying to adjust things!
To tackle this challenge, we've just release our MarCom Gantt solution which -- in a format similar to this How to Monitor and Manage MARGINS post -- I'd appreciate sharing and asking feedback.
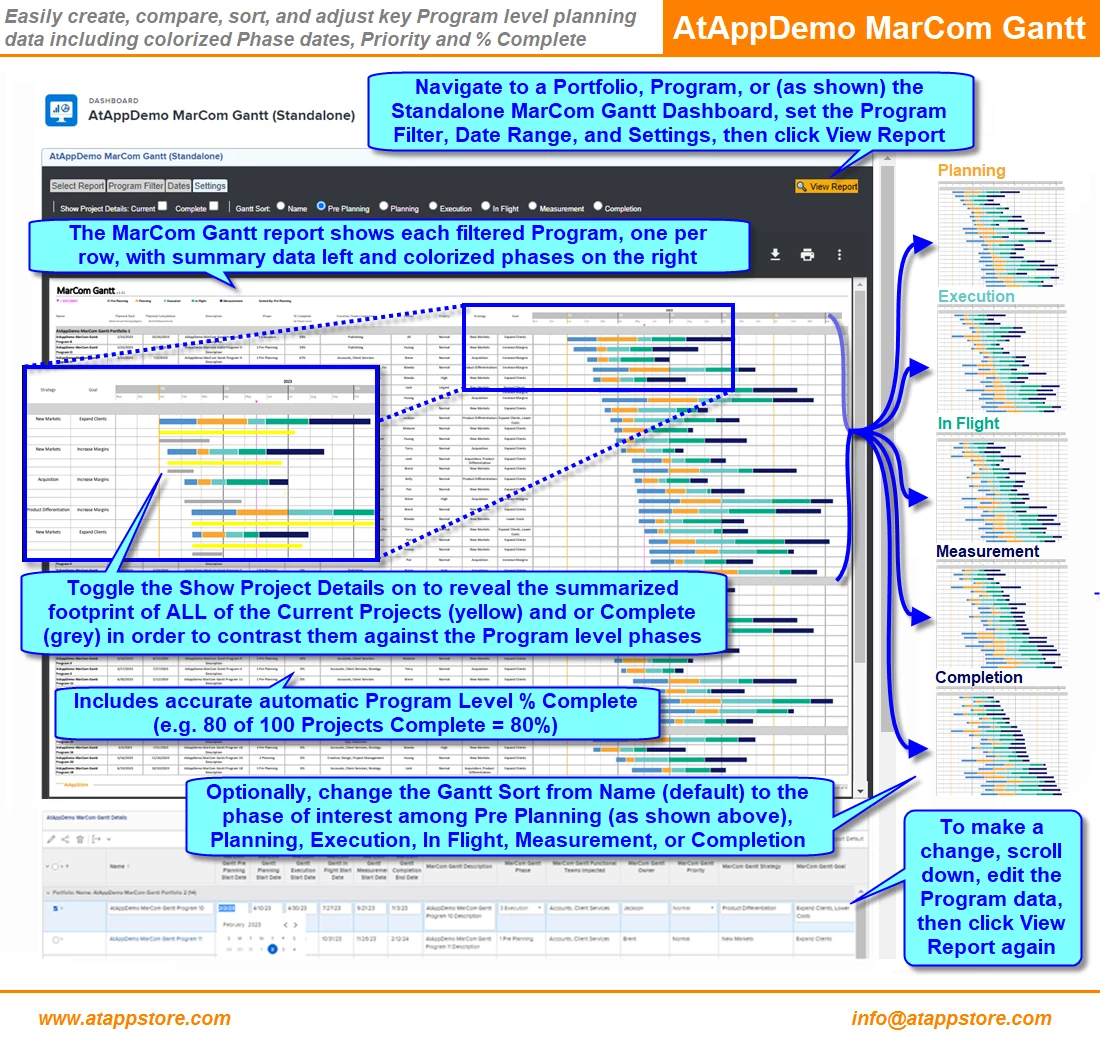
Here's a glossy that illustrates the highlights:

VIDEO
We've boiled the current full functionality down to a 2 minute video, which includes the following chapters:
- 00:00 Intro
- 00:04 Deploy AtAppDemo MarCom Gantt Package...
- 00:09 Navigate to the Standalone dashboard...
- 00:12 Select Program Filter...
- 00:23 Set the From and To Date...
- 00:30 Accept the Settings tab defaults...
- 00:33 Click View Report...
- 00:35 Phases are colorized according to the key dates...
- 00:41 Along with all current projects (in yellow)...
- 00:45 And all complete projects (in grey) for comparison...
- 00:50 Toggle off the Current and Complete options...
- 00:57 To gain additional perspectives sort by phase...
- 01:01 Pre Planning...
- 01:01 Planning...
- 01:03 Execution...
- 01:05 In Flight...
- 01:07 Measurement...
- 01:09 Completion...
- 01:11 Export the data to PDF, PowerPoint, Word, Image, or Excel...
- 01:17 To adjust the Program phase dates and other key data...
- 01:20 Scroll down to the bottom of the dashboard...
- 01:23 Expand the Portfolio of interest...
- 01:25 Update the data directly in the grid...
- 01:27 Then scroll up and View Report to instantly see the results
DISCUSSION
At your earliest convenience, I invite you to watch the 2 minute video (or chapters, above) and then share your thoughts below whether they are questions, answers, comments, or ideas. I will reply similarly, and will also periodically make targeted post for each chapter as a conversation starter (starting with the QUESTIONS below).
Thanks for your interest, and especially (in advance) your participation. I look forward to further discussion in due course!
Regards,
Doug
TIP: click the three dots above and then click "Follow" to be alerted when others add to the conversation
--------------------------------------------------------------------------------
QUESTIONS
- Do you use Portfolios and Programs to organize your Projects?
- Do your Programs have a special name in your industry or organization (e.g. Campaign, Commission, etc.)?
- Do your Programs run for a finite period of time?
- Is your Program planning broken into Phases?
- Do you need to adjust the timing of those Program periodically?
- Do you have any cool techniques that make it easy to quickly make such adjustments?
- Do you track Program Level % Complete (e.g. 80 of 100 Projects Complete = 80%)?

