Hi @kristens_wf
That's a work around I have not thought about. I'd like to hand off report to our client in an easy to read format (ie color coded) and WF just does not have the chops for it.
So you basically download to Excel and import in to MS Access?
I can't say I have created a cross tab query-based report before but I will look into it.
Thanks
Mark
Correct. Currently we have 4 Access queries for each report.
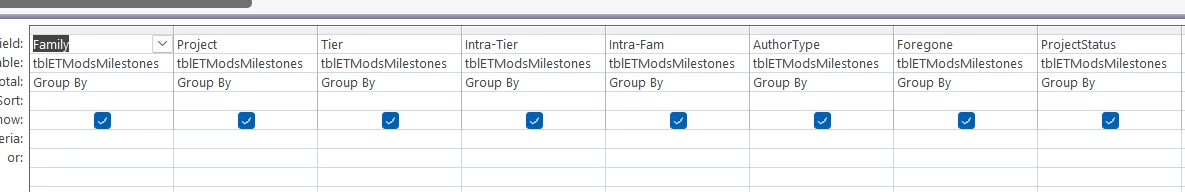
The first query just includes project-based fields that can be aggregated:
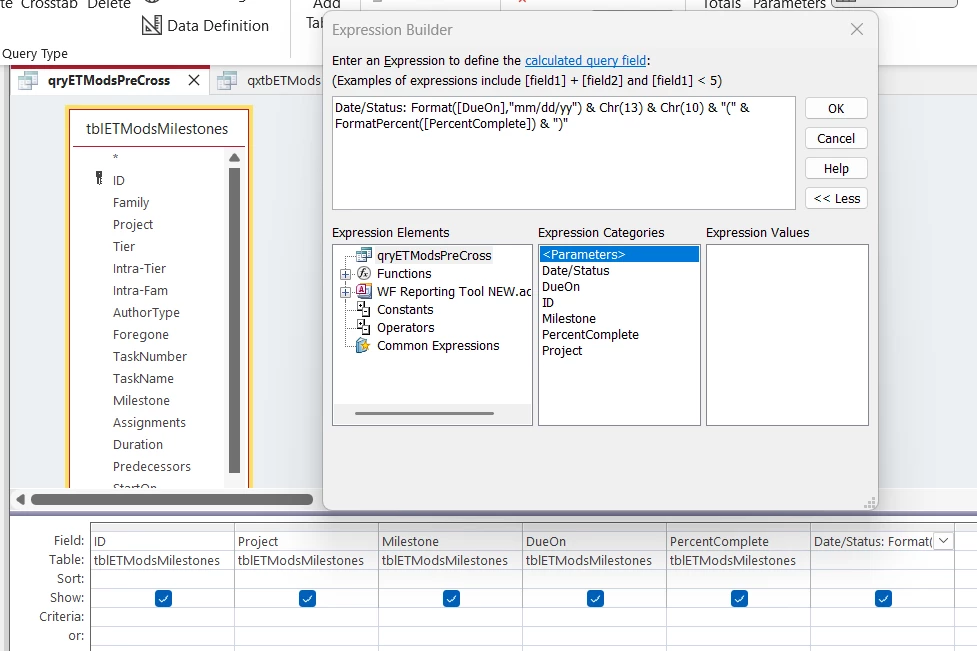
The second query includes the task-based fields that will form the heart of the crosstab; in it I created a custom field that includes both the task due date and completion percentage (on separate lines):
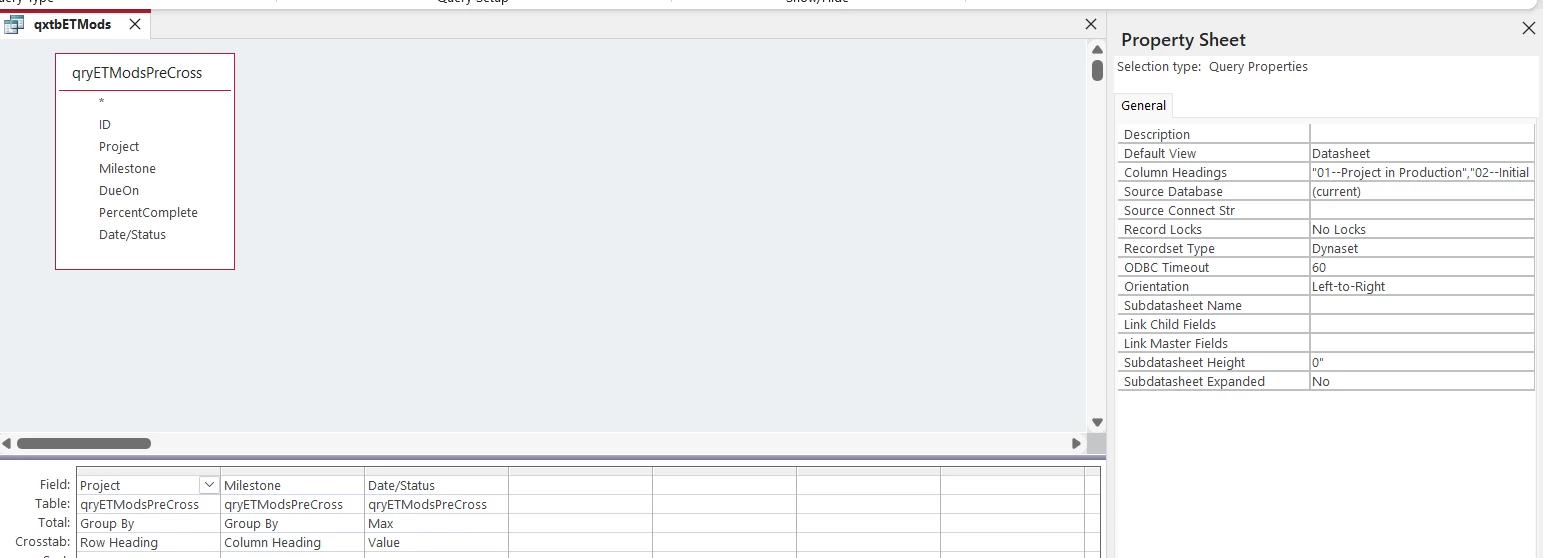
I then used this second query as the source for the actual crosstab query; I specified the milestone column headings in the order I want them to appear:
Finally I created a fourth query that joins the first query (with the grouped project info) and the crosstab query; the queries are joined using the project name:
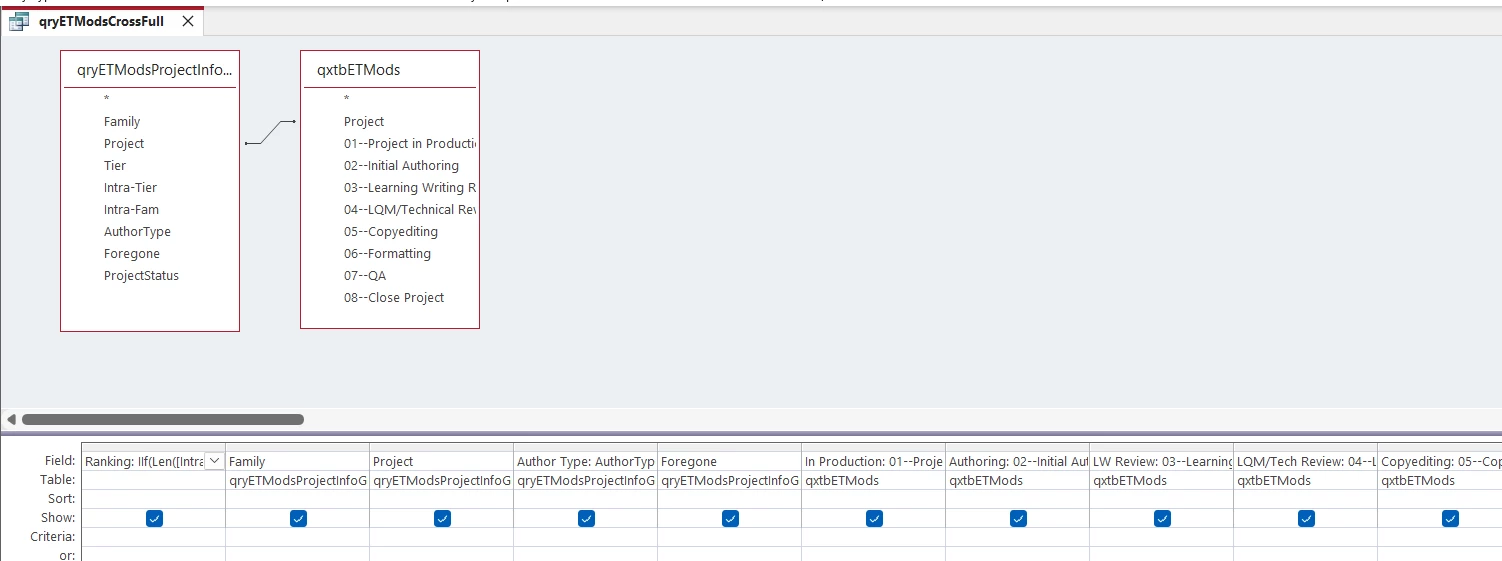
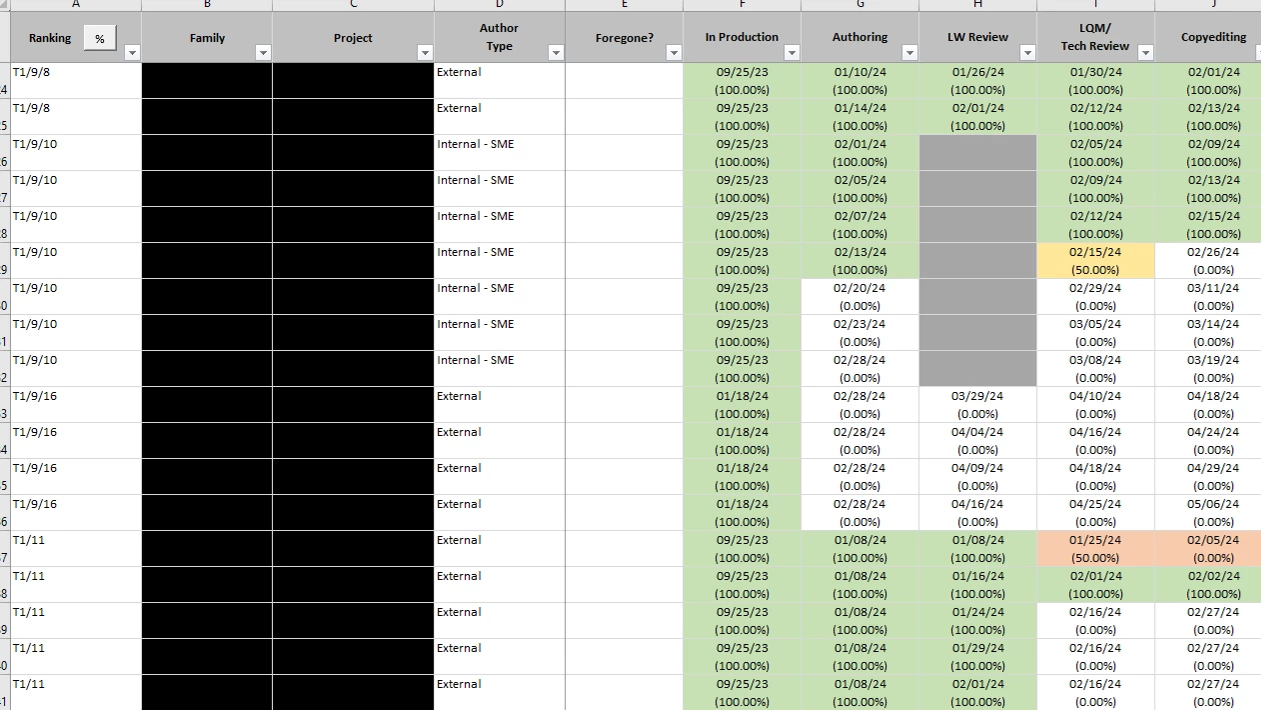
This last query is the one I export back to Excel. The conditional formatting in the report is based off of the date and completion percentage (milestones that are 100% complete are green; ones that are less than 100% and are due today are yellow; ones that are less than 100% and were due in the past are red; incomplete future tasks have no formatting; if a milestone/cell is blank, it's gray). I usually have the row widths set to only show the dates, but if I expand the row width, the percentage is also visible.
I've got coding in the Access tool that handles the import, export, and formatting of the Excel report. Ideally I'd love to be able to do all this in WF, but this has been working for us in the interim. Hopefully it will give you some ideas.

