Solved
Chart grouping by days the task was open
Hi all!
I feel like I'm missing something simple here, but I can't figure out what.
I want to create a chart on a task report that shows how many days the tasks were open. I don't want duration. I want the work day difference between the planned start date and the actual completion date ("days open").
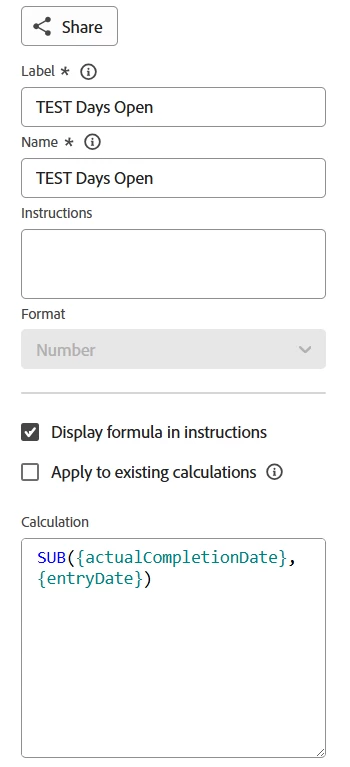
I was able to use text mode and valueexpression to create a column that shows this "days open" calculation.
My struggle now is I can't get it to show up in the drop downs on the chart to select it as a grouping.
I even created a text mode grouping to group by "days open".
Any ideas? Or is what I'm trying to do not possible?
Thank you!