Visualisation impossible par date | Community
Skip to main content
July 11, 2023
Solved

Visualisation impossible par date

  • July 11, 2023
  • 1 reply
  • 811 views

Bonjour, 


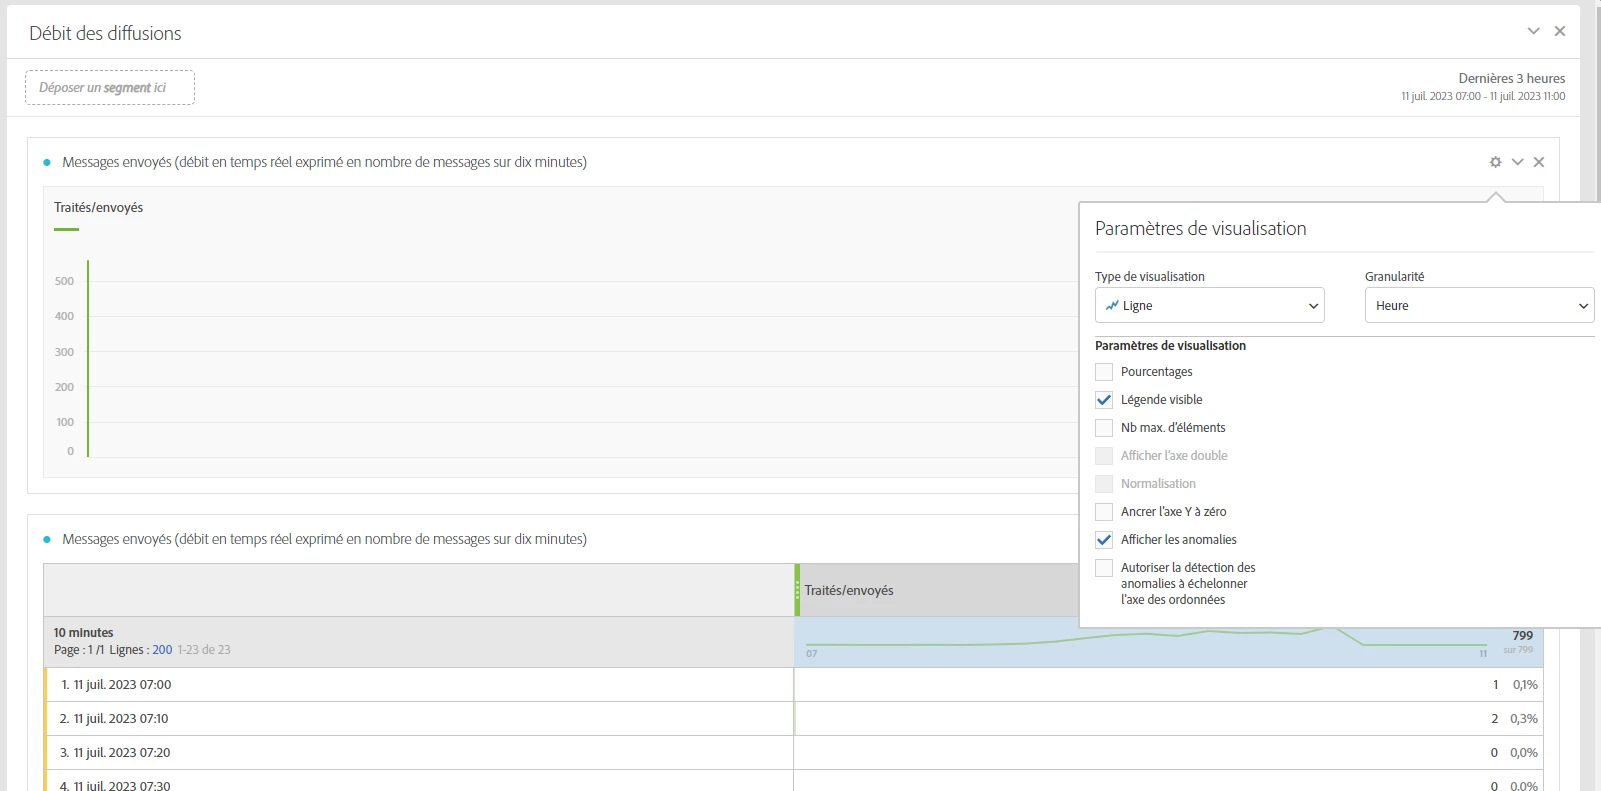
Dans mes rapports emailings sur Campaign Standard, il met impossible de visualisation mes métrics par date sous forme de graphique.

J'ai tenté de changé de granularité ainsi que de type de graphique mais je ne peux visualiser mes indicateurs à travers un graphique.

Je rencontre ce problème sur les rapports par défaut ainsi que mes rapports personnalisés. 


Merci pour votre aide

This post is no longer active and is closed to new replies. Need help? Start a new post to ask your question.
Best answer by SatheeskannaK

Hi @ceces, You can't get a report with metrics by date in ACS. It provides OOTB functionality to get the report using the date range and again that won't provide metrics split for each of the dates within that given range rather it will be the aggregate report of the date range provided.

If you're looking to get a granular/customized report you may want to explore other options for extracting raw data (broadlog/trackinglog) from ACS and built reports outside of ACS.

1 reply

SatheeskannaK
Community Advisor
SatheeskannaKCommunity AdvisorAccepted solution
Community Advisor
July 11, 2023

Hi @ceces, You can't get a report with metrics by date in ACS. It provides OOTB functionality to get the report using the date range and again that won't provide metrics split for each of the dates within that given range rather it will be the aggregate report of the date range provided.

If you're looking to get a granular/customized report you may want to explore other options for extracting raw data (broadlog/trackinglog) from ACS and built reports outside of ACS.

Thanks, Sathees
cecesAuthor
July 11, 2023

Hi @satheeskannak thanks for your quick answer. I honeslty thought I could arrange metrics by dates as it seems to be available on ACS reports. 

I will keep your advise in mind, thanks !