How to get the average daily sent per delivery code in a month? | Community
Skip to main content
Level 3
June 13, 2023
Solved

How to get the average daily sent per delivery code in a month?

  • June 13, 2023
  • 1 reply
  • 800 views

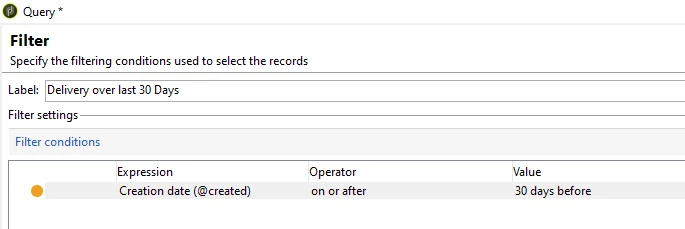
In my query in the additionnal column, in my ouput column I am trying to edit an expression to  get the  average of the daily success avg = ((success sent) x last 30 days)/30 per delivery code

But I am not sure to well write the function to use, any tips to wrote that down properly?


I have tried something like:

@averageDailySuccess = (Sum(IIF(@operation='D' AND @logDate > GetDate()-30, @successCount, 0)))/30


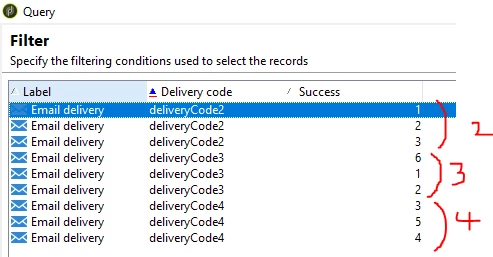
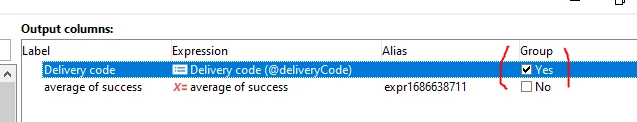
but It give an overall average over the last 30 days and not the average per delivery code. To get the average per delivery code, you would usually need to group by the delivery code and calculate the average for each group. This might not be possible within a single additional column expression - it may require additional steps or adjustments in how your data is queried or processed. But I am not sure about how to do this too

This post is no longer active and is closed to new replies. Need help? Start a new post to ask your question.
Best answer by ParthaSarathy

Hi @rbiri ,

You can try the below query configuration,


Targeting Dimension: nms:delivery

Filtering Dimension: nms:delivery

Query:

 @created on or after DaysAgo(30)

In my case, in preview tab,


So the expected average of deliveryCode2 is 2 and deliveryCode3 is 3 and deliveryCode4 is 4.


Complementary information > add data > 

- select delivery code (@deliveryCode)

- Add an expression >      Avg([indicators/@success])

Click Group check box on @deliveryCode alone > finish > save the query


Reopen the query > edit additional data > advanced parameter > do the configuration as below,

And run the workflow,

The output:

Received the expected average success per delivery code on last 30 days.


1 reply

ParthaSarathy
Community Advisor
ParthaSarathyCommunity AdvisorAccepted solution
Community Advisor
June 13, 2023

Hi @rbiri ,

You can try the below query configuration,


Targeting Dimension: nms:delivery

Filtering Dimension: nms:delivery

Query:

 @created on or after DaysAgo(30)

In my case, in preview tab,


So the expected average of deliveryCode2 is 2 and deliveryCode3 is 3 and deliveryCode4 is 4.


Complementary information > add data > 

- select delivery code (@deliveryCode)

- Add an expression >      Avg([indicators/@success])

Click Group check box on @deliveryCode alone > finish > save the query


Reopen the query > edit additional data > advanced parameter > do the configuration as below,

And run the workflow,

The output:

Received the expected average success per delivery code on last 30 days.


~  ParthaSarathy S~  Click here to join ADOBE CAMPAIGN USER GROUP for Quarterly In-person | Hybrid | Virtual Meetups
rbiriAuthor
Level 3
June 15, 2023

thank you!